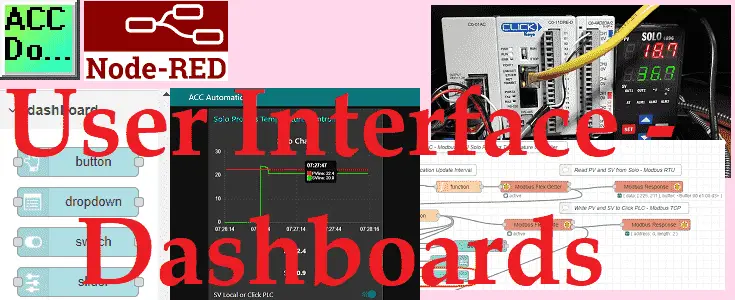
Node-RED can easily display interactive information to the user or operator using a web browser on your phone, tablet, or computer. Any device that has access to the network in which node-red is running.
We will be installing the node-red-dashboard palette. This allows us to create a live data dashboard user interface. (UI)
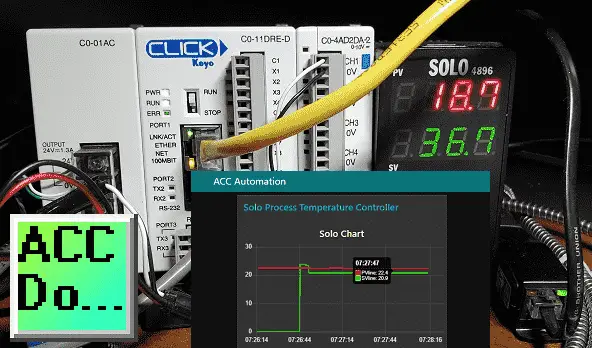
The information from our Solo process temperature controller will be displayed. Setpoint information can be set either by the dashboard UI or the Click analog input signal. This will be selected via the user interface. Let’s get started using Node-RED Dashboards.
In this series we started using Node-RED in some of the following ways:
Installing the Windows Software – Video
Modbus Communication – Video
We will continue with the following:
Display Information on a user interface, HMI, or dashboard
Log information into a database
View information in the database through spreadsheets such as Excel.
Previously we installed Node-RED Modbus Palette on our windows 10 computer. We then communicated Modbus RTU (serial) and Modbus TCP (Ethernet) to a Solo Process Temperature Controller and a Click PLC. I would recommend that you review the following Node-RED Essentials Videos (Basics of the Editor) before continuing. This will allow you to become familiar with the editor.
Watch the video below to see the operation of the Node-RED Dashboard.
Installing node-red-dashboard Palette
Node-RED Dashboard User Interface UI
At the command prompt type node-red. This will start the program. Our previous Modbus communication program will load.
The editor is browser-based. Open your browser and type http://localhost:1880/
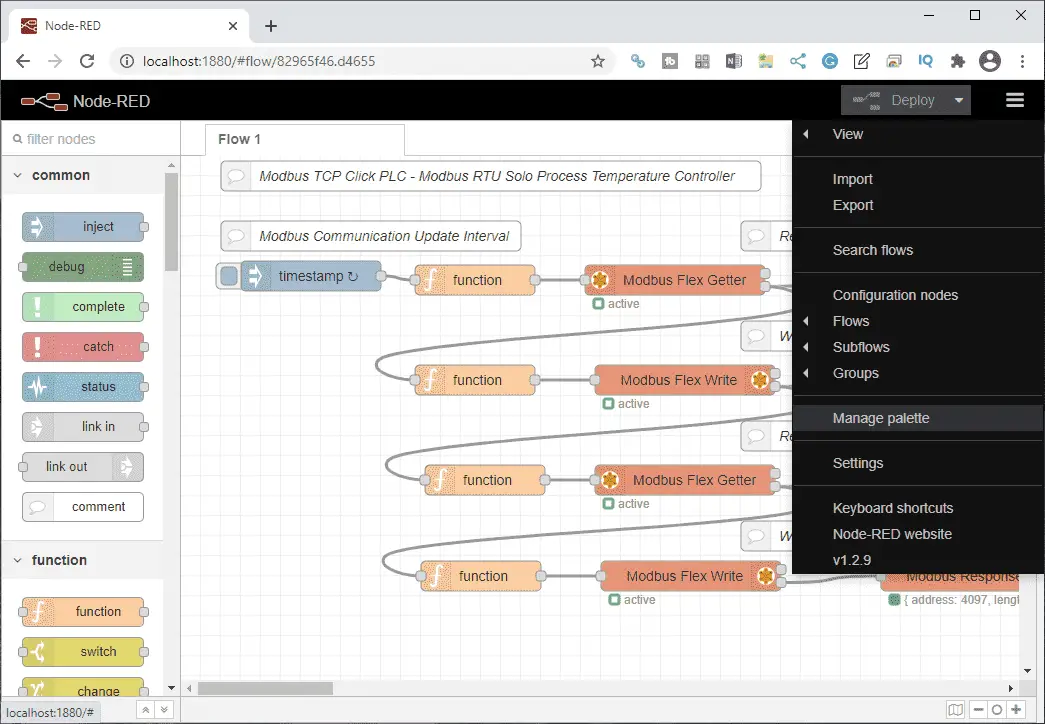
On the main header click the menu three lines (pancake icon) and select manage palette.
Under the user settings menu, select the palette on the left-hand side. This will show you the current nodes that you have installed. We currently have only the default nodes installed.
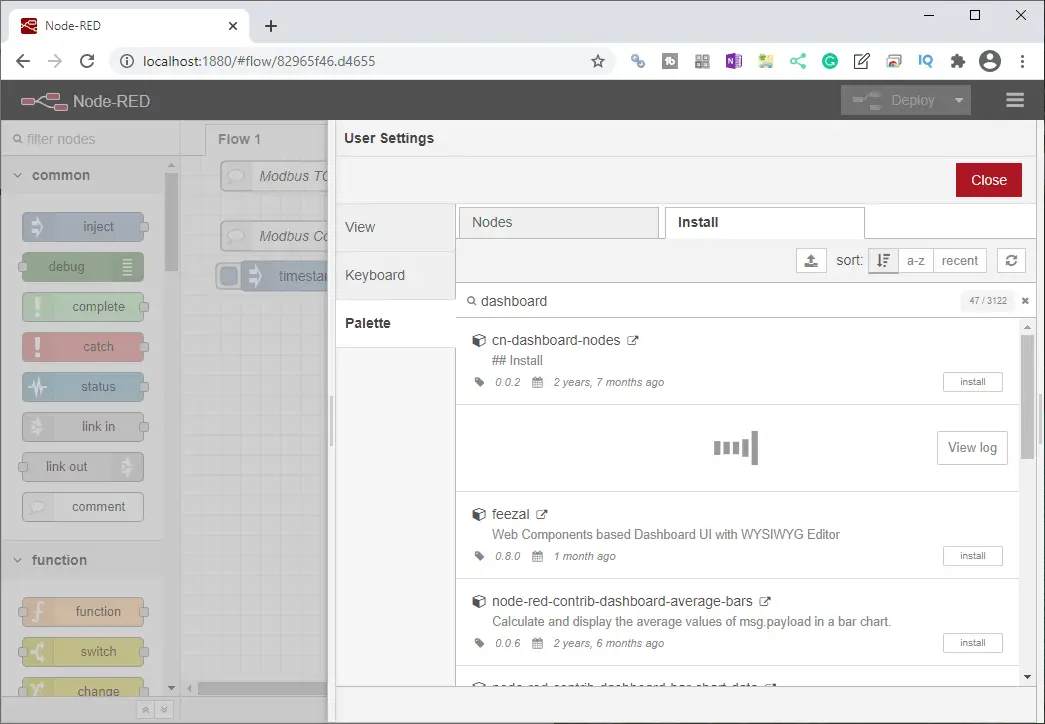
Select the install tab.
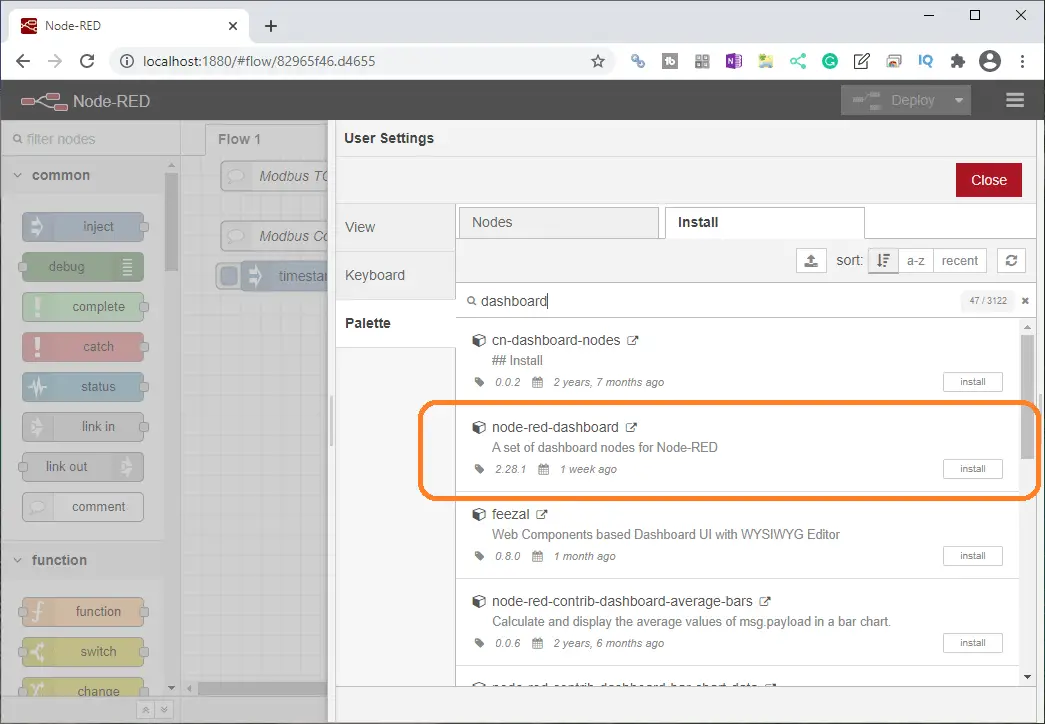
Type in ‘dashboard’ in the search field and press enter. Select the install button on the node-red-dashboard palette.
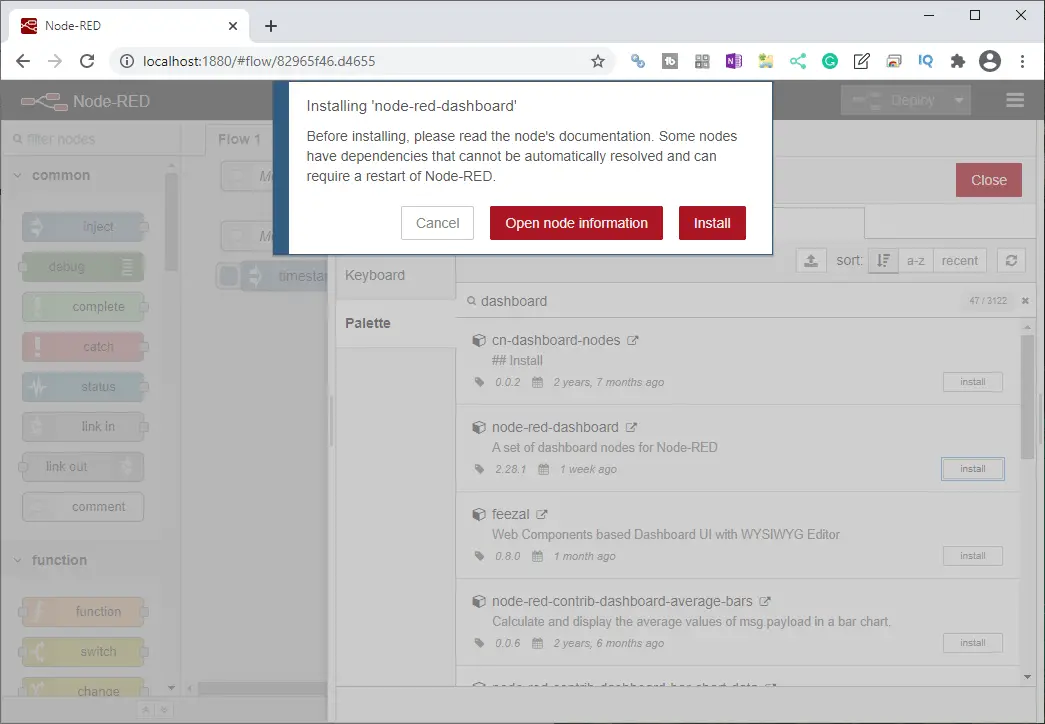
On the pop-up window select install.
Our new dashboard UI will now be installed.
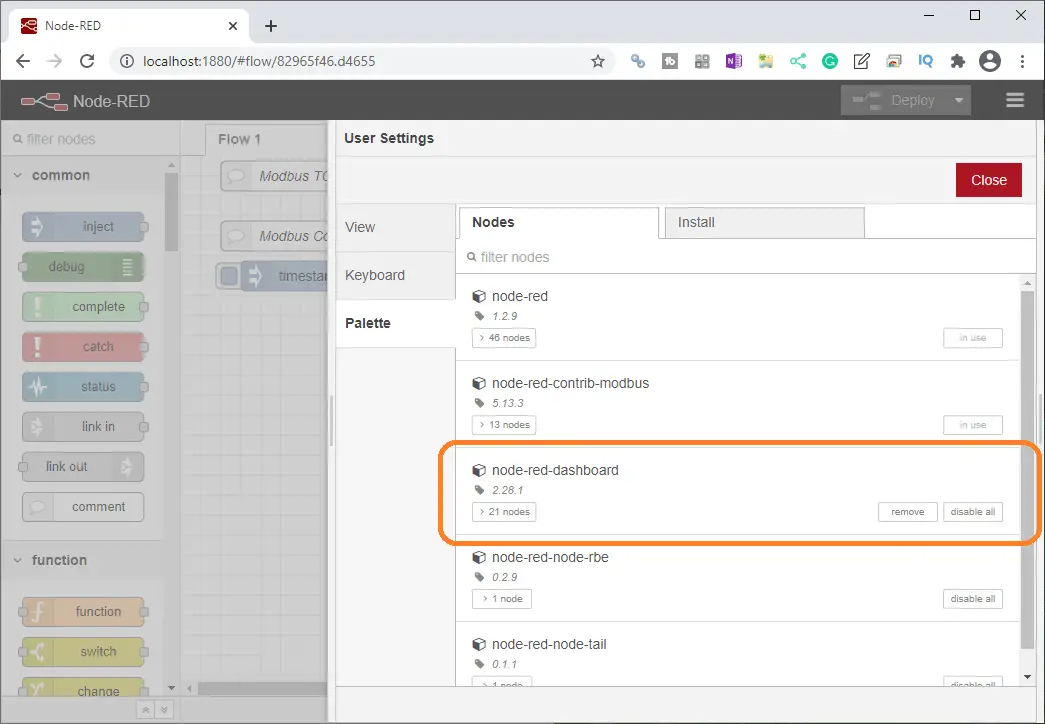
The Node-Red Dashboard UI palette is now installed. We can now select the close button to close the user settings window.
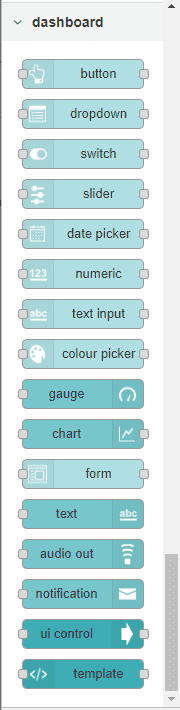
The palette on the editor will now contain the nodes that we will need for creating a user interface dashboard. These nodes contain a lighter color (inputs) and a darker color (outputs) for our user interface.
Node-RED Variable Scopes
Node-RED has three types of variable scopes. Context, Flow, and Global objects are used for variable scopes.
Context object will store data for a node
Flow object will store data for a flow
The global object will store data for the canvas
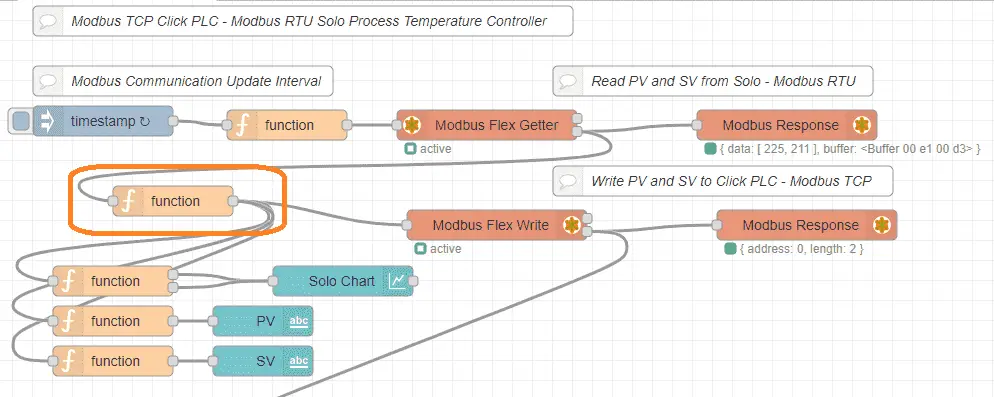
Flow Modifications for Dashboard
Set PV ans SV Variables
We will modify the function node after the Modbus RTU read of the Solo process temperature controller.
var values = msg.payload.data;
msg.payload = {
'value': values,
'fc': 16,
'unitid': 1,
'address': 0,
'quantity': 2
}
flow.set("PV", msg.payload.value[0]);
flow.set("SV", msg.payload.value[1]);
return msg;
The present and set values will now be available anywhere in the flow.
Node-RED Dashboard Chart
A chart output and function will be used to display the present and set values over a time period.
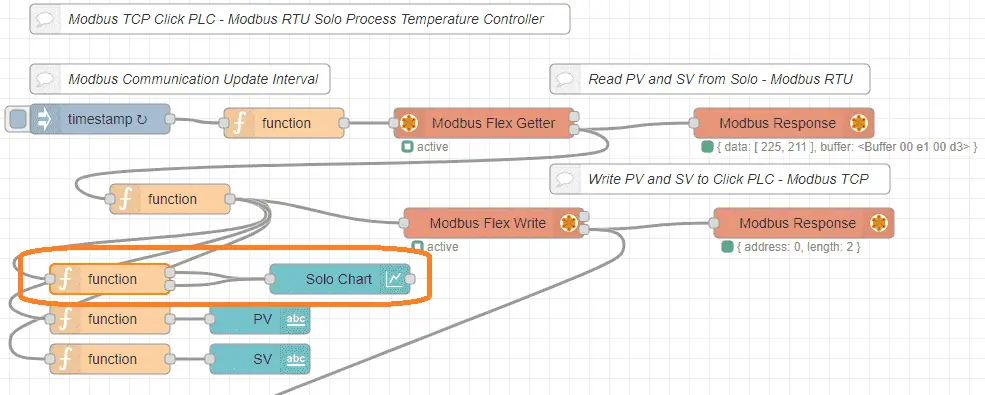
The function node before the chart will set up our variables.
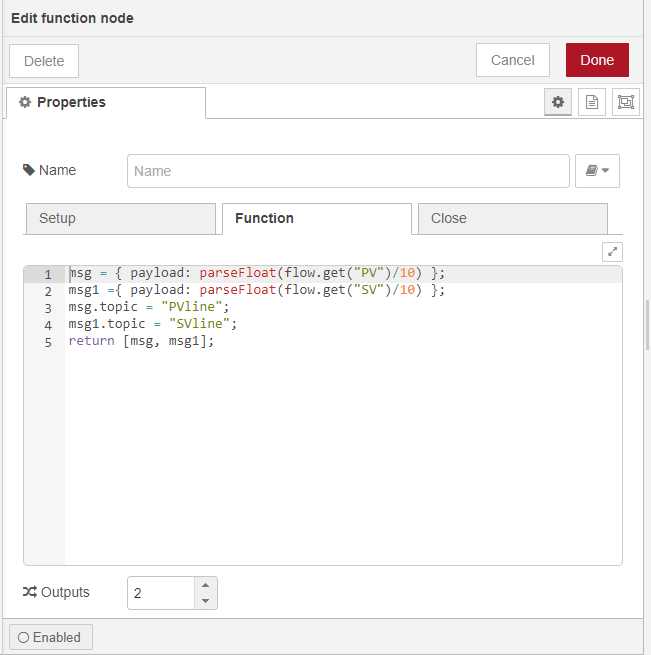
The outputs are set for two. Topics are used to determine the chart items. Values are converted to afloat with one decimal. (Divide by 10)
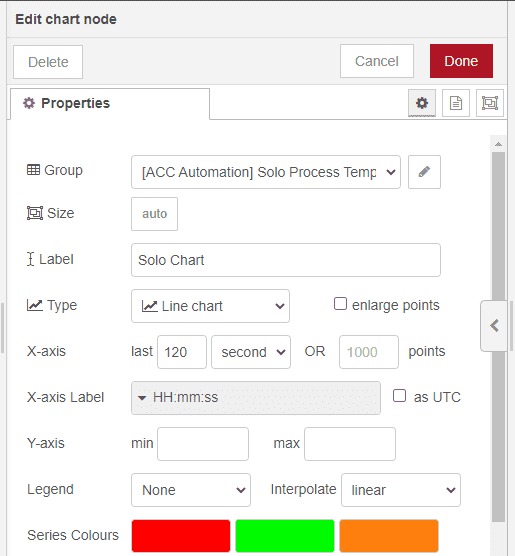
The chart properties will set the x-axis to 120 seconds. This is so we can quickly see our parameters as they change on the chart. The first two colors in the series will determine the line colors. Select the group edit icon.

The Name will be what appears on the group of UI items. The tab is the name of the overall page.
Node-RED Dashboard Text
The Text node of our dashboard will be used to display the current present and set values of the Solo.
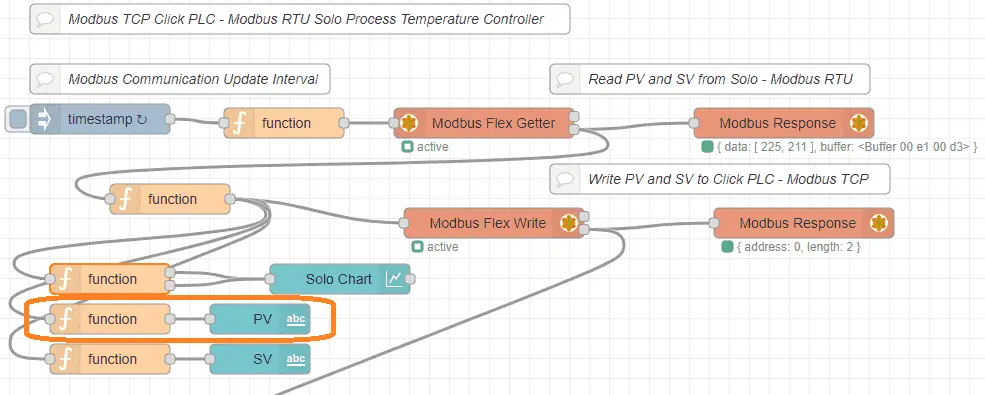
A function node will be used in front of the text node to set up the values to be displayed.
msg = { payload: parseFloat(flow.get("PV")/10) };
return msg;
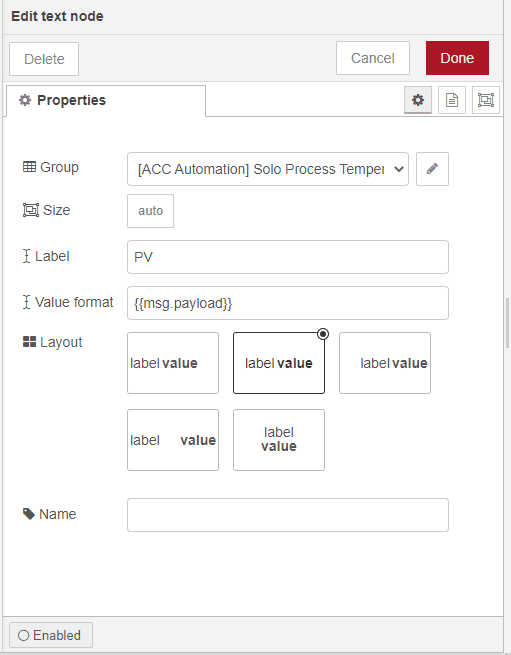
The properties of the text node will be to label it PV and center the layout.
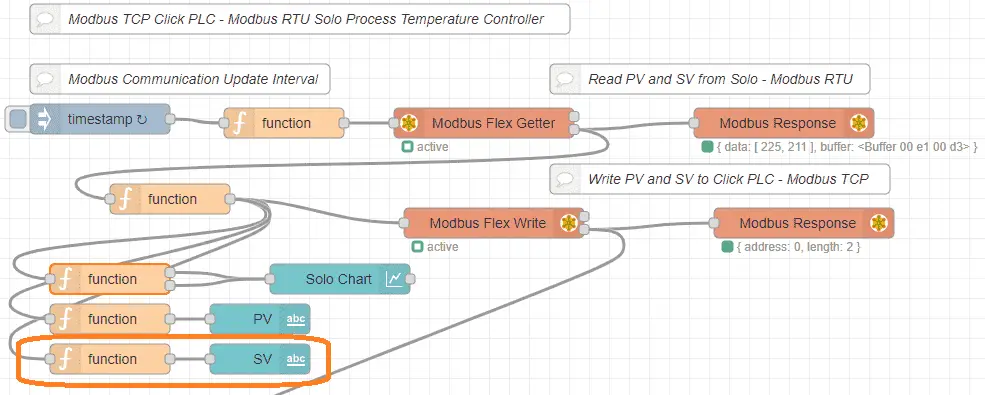
The value for the SV will be retrieved from the flow variable in the function node.
msg ={ payload: parseFloat(flow.get("SV")/10) };
return msg;
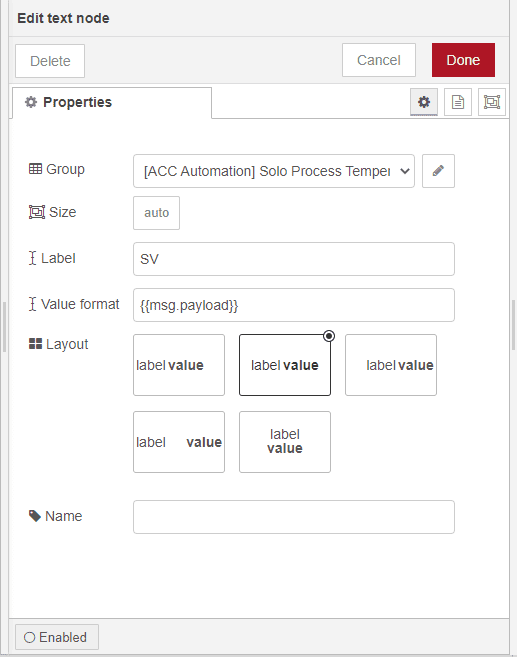
The SV will be displayed with the text node. The label will be SV and the layout will be centered
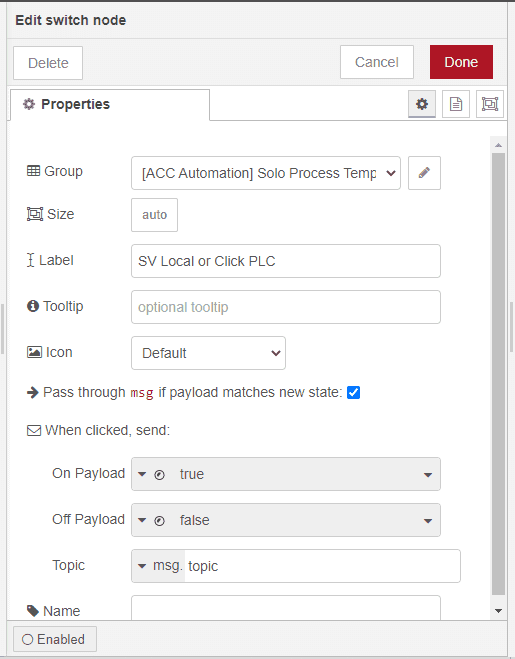
Node-RED Dashboard Switch
Once we have read the SV from the Click PLC we will insert a dashboard switch. This switch will determine if the SV is coming from the Click PLC (Default) or locally from a dashboard slider switch.
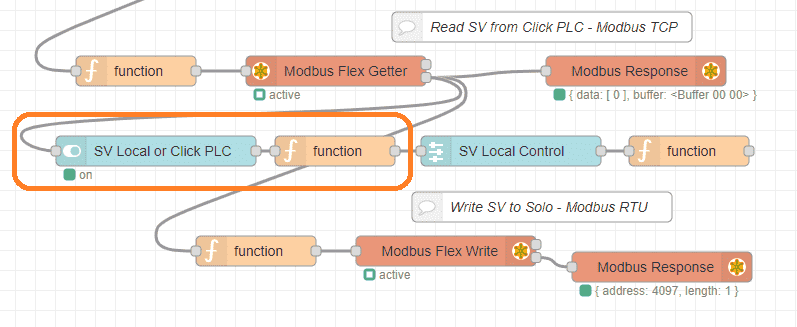
Here are the dashboard switch properties.
The function node will now take the switch information and place this in a flow variable called a switch.
flow.set("Switch", msg.payload);
return;
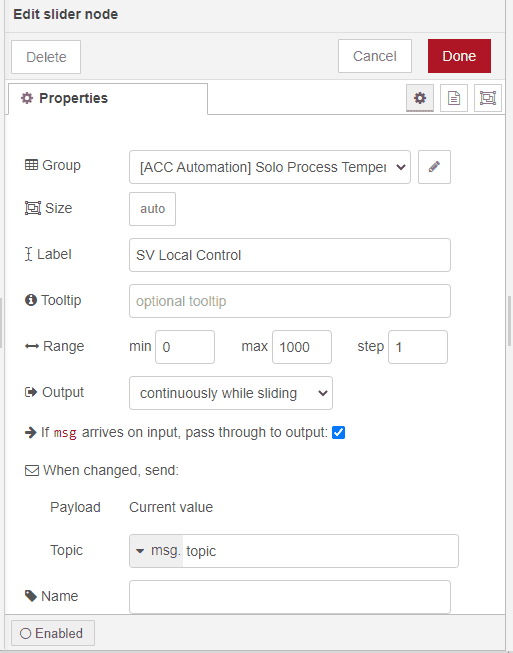
Node-RED Dashboard Slider
We will use the slider switch to set the SV of the Solo locally.
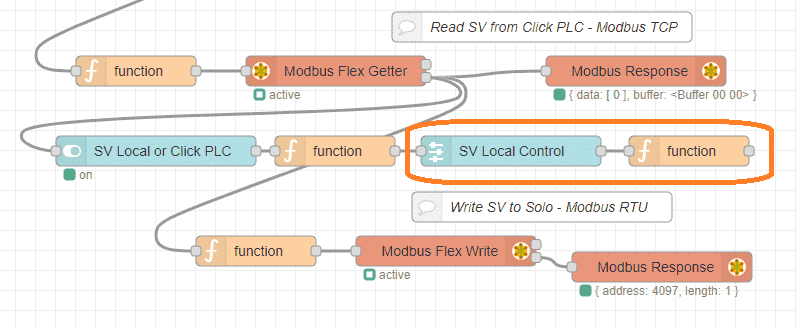
The slider will be labeled SV Local Control and be scaled from 0 to 1000 in single steps. This scaled value will actually relate from 0.0 to 100.0 in degrees C on our temperature controller.
The function block will write the variable so we can use it later in the flow.
flow.set("Slider", msg.payload);
return msg;
Selection of Local and Click SV
We will modify the function nod just before the Modbus RTU write to determine the information that will be set for the SV value.
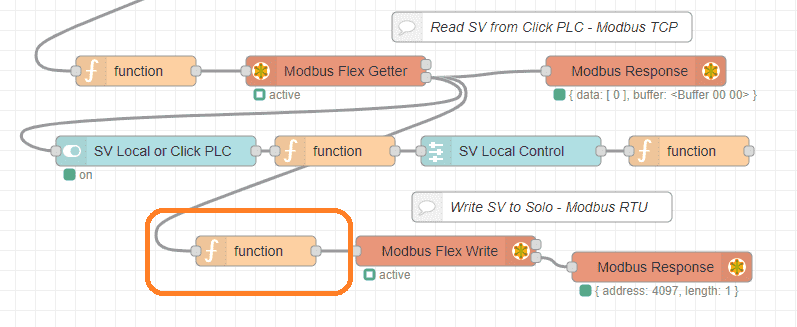
var values = [msg.payload.data[0]];
if (flow.get("Switch"))
{
values = [flow.get("Slider")];
}
msg.payload = {
'value': values,
'fc': 16,
'unitid': 1,
'address': 4097,
'quantity': 1
}
return msg;
Node-RED Dashboard Layout
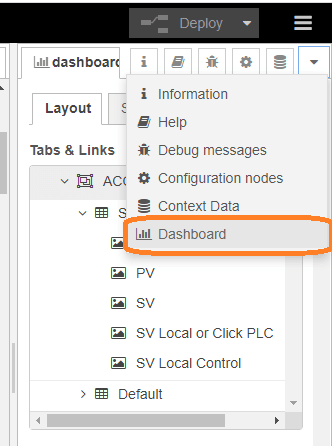
On the sidebar, select the arrow down to call up the dashboard.
The first tab on the dashboard is the layout.
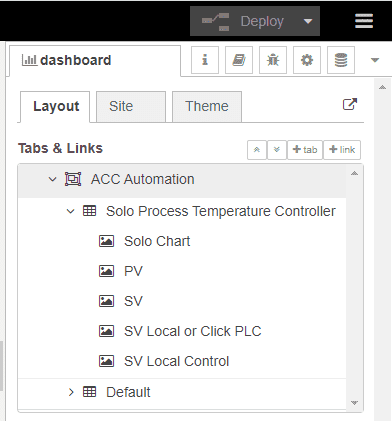
On the layout, you can arrange the order of the controls on the user interface. Select the site tab.
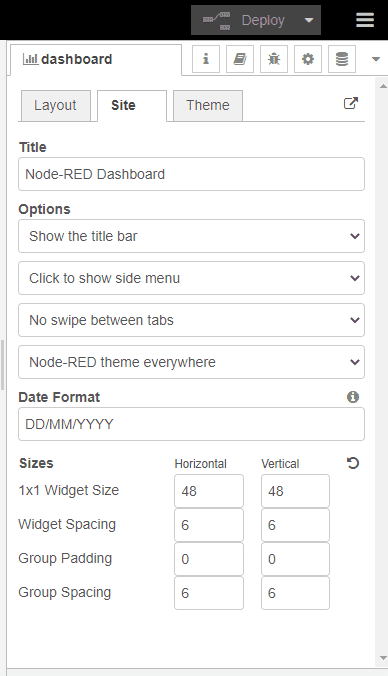
The site tab is where you can adjust the size of the UI and change some of the default parameters of the dashboard. Select the theme tab.
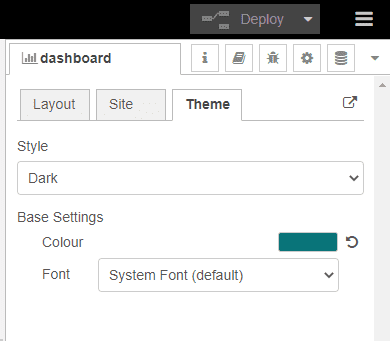
On the style, we changed the light (default) to dark.
Running Node-RED Dashboard
Run the user interface in any browser by using the IP address followed by a backslash and UI.
Example: http://localhost:1880/UI
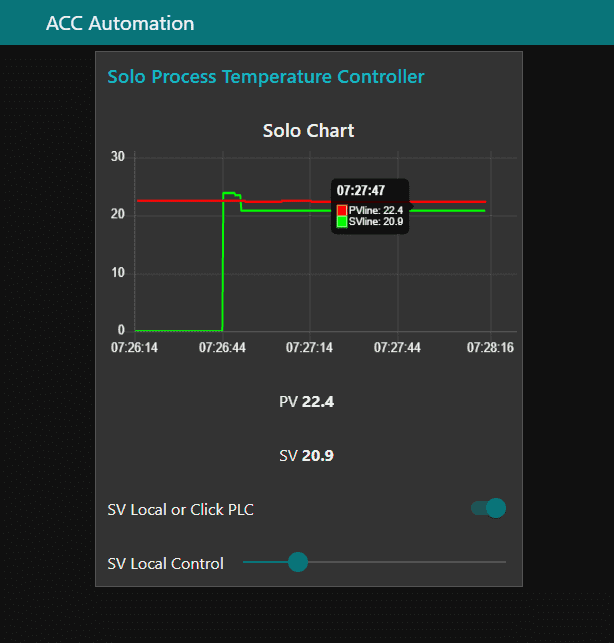
Watch the video below to see the Node-RED Dashboard user interface monitor and control the Solo and Click controllers.
This series will continue with:
Logging information into a database
View information in the database through spreadsheets such as Excel.
Download the Click Program and Flow here.
Node-RED Links
Node-RED Organization Home Page
Getting Started – Run Locally
Node-RED running on Windows (Run at Startup)
Securing Node-RED
Node-RED Essentials Videos (Basics of the Editor)
Learn JavaScript Free
w3schools JavaScript Tutorial
learn-js.org
Node-Red JavaScript Primer
Modbus
Node-RED Modbus TCP and Serial
Dashboard – HMI
Node-RED Dashboard
Node-RED Dashboard extra nodes
SQL Database
Node-RED SQL Database
Node-RED SQL Plus – Execute queries and stored procedures
Modbus Learning Links:
Simply Modbus Frequently Asked Questions
Modbus TCP/IP Overview – Real-Time Automation
All You Need to Know About Modbus RTU – Video
Next time we will Log information into a database using Node-RED.
Watch on YouTube: Node-RED User Interface – Dashboards
If you have any questions or need further information please contact me.
Thank you,
Garry
If you’re like most of my readers, you’re committed to learning about technology. Numbering systems used in PLCs are not difficult to learn and understand. We will walk through the numbering systems used in PLCs. This includes Bits, Decimal, Hexadecimal, ASCII, and Floating Point. To get this free article, subscribe to my free email newsletter.
Use the information to inform other people how numbering systems work. Sign up now. The ‘Robust Data Logging for Free’ eBook is also available as a free download. The link is included when you subscribe to ACC Automation.