We will now look at monitoring and testing our BRX Do-More program in our controller. Our first program for the BRX Do-More PLC involved a start-stop jog circuit. We will now use the Do-More Designer Software to monitor, test, and modify this program. As a system integrator, this ability can prove very useful to you in the field when troubleshooting your automation system.
We will be monitoring the ladder logic status and bits. Changing the bit status will be done by forcing the inputs and outputs.
Here is a link explaining the logic behind our circuit.
How to Make a Start Stop Jog Circuit in a PLC
Let’s get started.
Previously in this BRX Do-More series PLC, we have discussed:
System Hardware – Video
Unboxing – Video
Installing the Software – Video
Establishing Communication – Video
Firmware Update – Video
Numbering Systems and Addressing – Video
First Program – Video
Status Monitoring – BRX Do-More (Testing)
When we are online with the controller in the Do-More Designer software the status icons will be active in the main menu. You can call up the status viewing by the main menu | Debug | Status, keyboard Ctrl+Shift+S, or by the status icon on the main menu. The status will indicate whether a bit is on or off, or the value in registers (words) will be displayed. This will help you monitor and test your program.
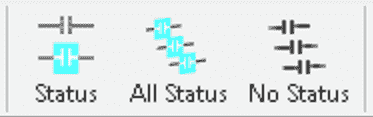
The meanings of the icons are as follows:
Status – Enables status for the current view
All Status – Enables status for all open views
No Status – Disables status for all open views
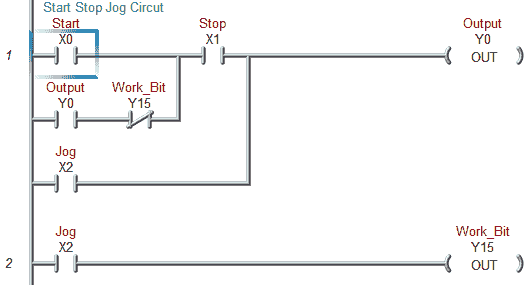
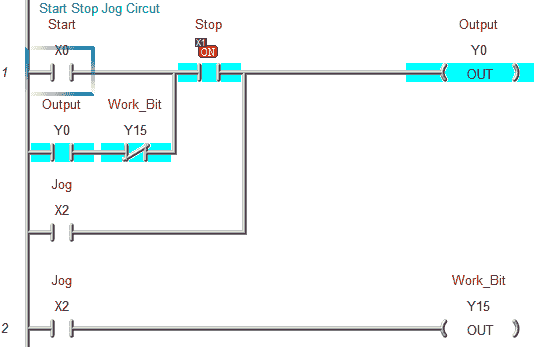
Here is our ladder logic without the status view enabled.
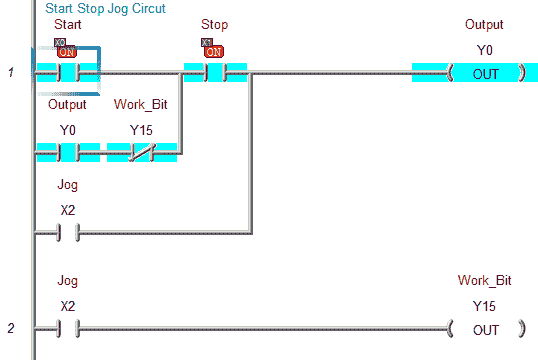
With the status enabled you will see our normally closed contact bit Y15 is highlighted. This indicates that the input is looking for a 0 and has found it.
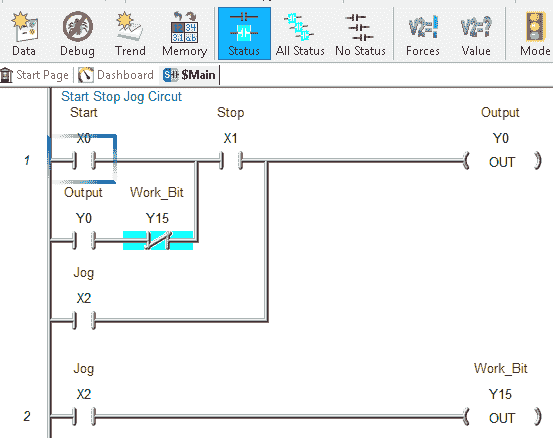
Notice that when the status view is on the icon is also highlighted.
Monitoring your program status is one way to ensure that the logic entered is correct and functioning as expected.
Forcing and Changing I/O Status – BRX Do-More (Monitoring / Testing)
The forces and value icons on the main menu will allow us to modify bits and registers in our controller. This is extremely helpful when testing your program.
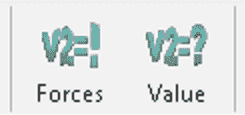
The main difference between a force and a value change is the force will maintain the status even though the scan of the PLC is indicating that the value should be different. The value change will change the status of the bit or register but if the scan of the controller changes the value it will not maintain the value change setting.
See a review of PLC program scanning from the following post. Understanding the PLC Program Scan
To call up the change value or configure forces you can hit the icon when online to the controller in the main menu. Some other ways are as follows:
Change Value – Main Menu | Debug | Change Value… (Ctrl+Shift+F2)
Configure Forces – Main Menu | Debug | Configure Forces…
Normally I will use the following method to force I/O.
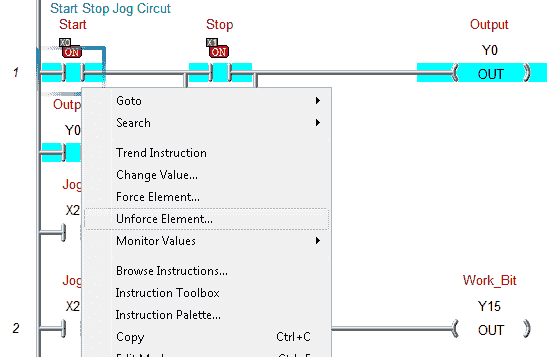
Right-click on the contact that you want to force. In my case right-click on the X1 Stop bit.
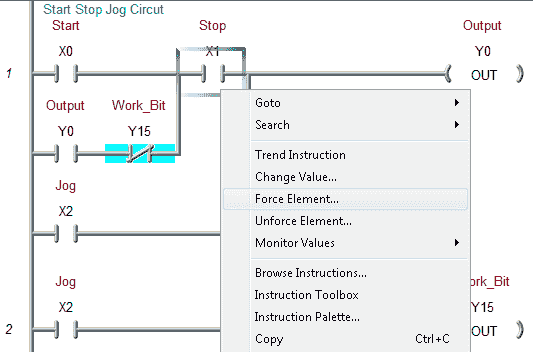
A menu will now appear that will allow you to select Force Element…
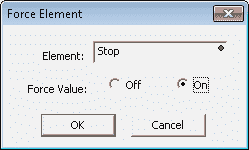
Select the Force Value On and select OK
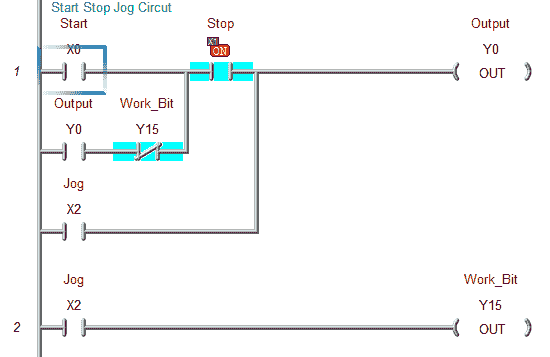
Our ladder program will now show an ON in red at the X1 input bit. This indicates that the input is forced and will remain ON in our case until we release the force.
When forces are enabled in the BRX Do-More PLC the run light will turn orange indicating that forces are enabled in the controller.
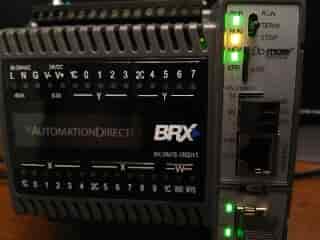
The orange light will turn green once again when all of the forces are no longer enabled.

The status bar at the bottom of the program window will also indicate that forces are now being used.
We can now force our start bit to turn on our output.
Unforce the element by again right-clicking on the contact and selecting Unforce Element…
An unforce element window will now display indicating the element to unforce.
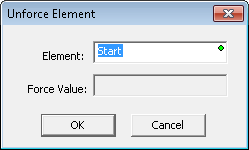
Hit OK. You can now see that we have successfully turned on our output by forcing our start input bit memory on and then off. This will maintain our output through our forced stop bit memory.
Alternatively, you can hit the icon Forces in the main menu.
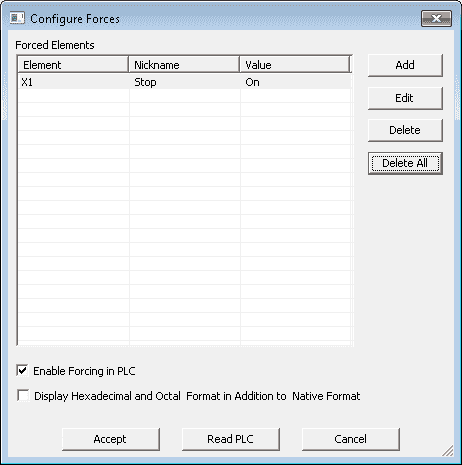
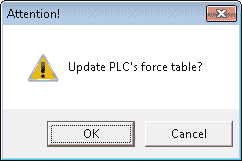
A window will now appear that will show all of the forces that you have in your program. To un-force all of the items, select ‘delete all’ from the menu at the side of the window.
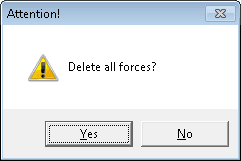
A confirmation window will appear. Select Yes to delete all forces.
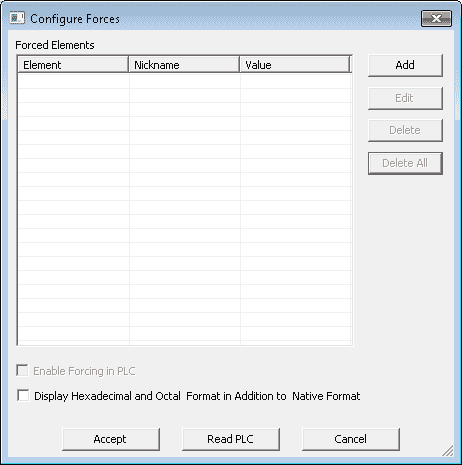
This will bring us back to the configure forces window. We must now hit the Accept button at the bottom of the screen for the unforces to take effect.
Hit OK. This will now return us to our ladder diagram without any forces in effect.
Data View – BRX Do-More (Monitoring / Testing)
Data view will allow us to view several items at once in a table format. This is useful in monitoring, testing, and troubleshooting our programs. We can also save our data view windows so we can retrieve and monitor them at a later time.
The easiest way to use data view is to point on the rung or rungs (highlighted) and right-click. This will bring up a menu.
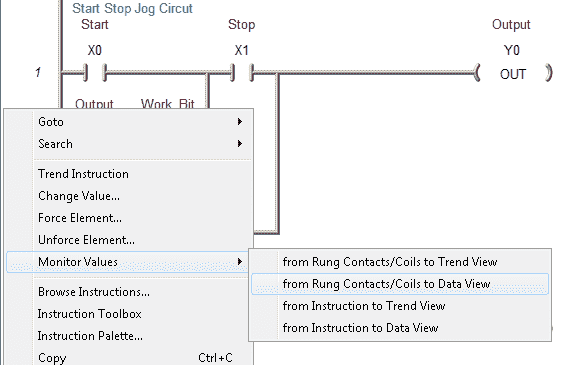
Select Monitor Values – from Rung Contacts/Coils to Data View
This will automatically list all of the elements in our rung(s) in the data view menu.
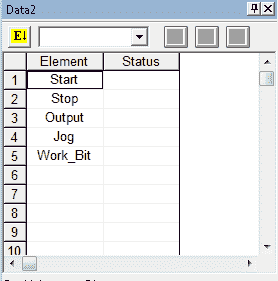
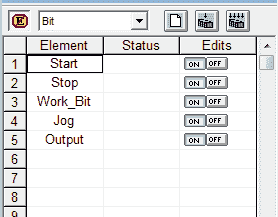
Hit the E highlighted in yellow. This will allow you to edit the values in the list.
Note: At any time you can right-click on the data view screen and select ‘save’ or ‘save as’ to save your data view file to disk.
You can now change the values in the bits, or right-click and select force element.
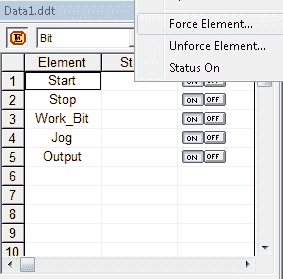
The data view is often used for quickly finding parameters in the program that need to be monitored.
You can watch the video below to see how you can monitor and test the program on the BRX Do-More Series PLC.
BRX Do-More Series PLC from Automation Direct – Power to deliver
Overview Link (Configure and purchase a system)
Manuals and Product Inserts (Installation and Setup Instruction)
Do-More Designer Software v2.0.3 (Free Download Link) – The software will contain all of the instruction sets and help files for the BRX Do-More Series PLC.
Next time we will look at the Debug Mode and On-line Editing in the BRX Do-More PLC.
Watch on YouTube: BRX PLC Monitoring and Testing the Program
If you have any questions or need further information please contact me.
Thank you,
Garry
If you’re like most of my readers, you’re committed to learning about technology. Numbering systems used in PLC’s are not difficult to learn and understand. We will walk through the numbering systems used in PLCs. This includes Bits, Decimal, Hexadecimal, ASCII and Floating Point.
To get this free article, subscribe to my free email newsletter.
Use the information to inform other people how numbering systems work. Sign up now.
The ‘Robust Data Logging for Free’ eBook is also available as a free download. The link is included when you subscribe to ACC Automation.