We will now look at monitoring and testing our productivity program. The Productivity Suite Software provides tools for us to monitor and test our programs. Last time we used Tag Names and Details, Task Names and Descriptions, Rung Comments, and Instruction comments to document our first program and transferred this to our connected Productivity 1000 Series PLC. We will be monitoring our ladder using the ladder editor window and display the information in two different ways. Data View is a powerful tool to help us to test and view our program. We will be forcing the IO, toggling the IO view, and graphing our tags to test our PLC logic circuit.
Let’s get started.
Previously in this Productivity 1000 series PLC, we have discussed:
System Hardware – Video
Installing the Software – Video
Establishing Communication – Video
First Program – Video
Documenting the Program – Video
Productivity Program Monitoring
The monitoring mode on the ladder editor offers two display modes. The default shows the coils with Green (ON) or Red (OFF) line color. This may be preferable when programming and troubleshooting on a desktop.
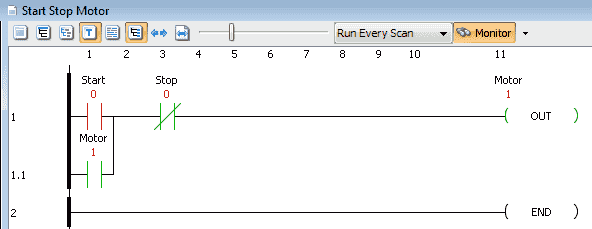
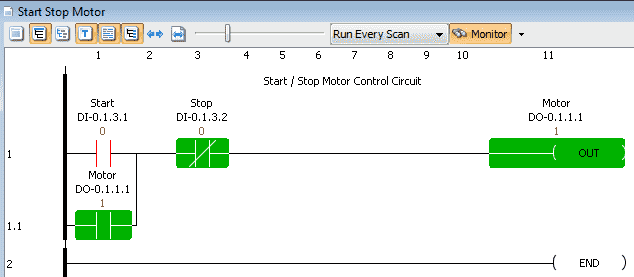
The other monitoring mode is called Block Fill. This will reflect the states of your logic with Green (ON) fill or Red (OFF) line colour for your contacts and coils. It will make viewing the states of your logic much easier on plant floors and when monitoring the logic from a distance.
Call up the Options menu by selecting Tools | Options | Ladder tab from the main menu.
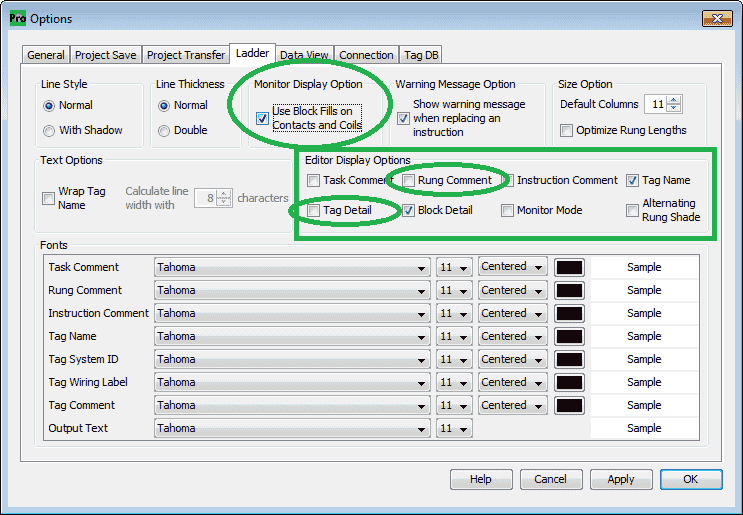
Select the Use Block Fills on Contacts and Coils under the Monitor Display Option.
Editor Display Options
While we are in the ladder options menu, select Rung Comment and Tag Detail under the Editor Display Options. This will default to display these documented items automatically when we open our project.
Hit apply to have these items changed. Click OK to close the options window.
We can now see the block fill option in action.
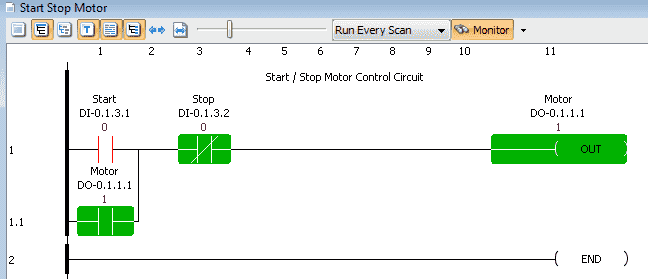
Data View – Productivity Monitoring Program
The Data View panel allows monitoring and manipulation of Tag values in the CPU. Multiple Data View tables (Tabs) can be made within a Data View window.
We can call the Data View panel a few different ways.
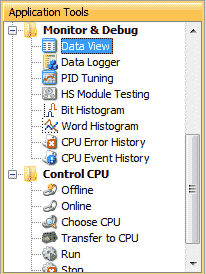
Select “Data View” from the Monitor & Debug heading under the Applications Tools.
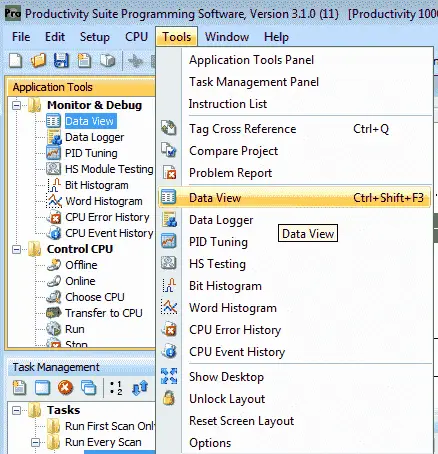
We can also use the main menu. (Tools | Data View) The keyboard short cut is Ctrl + Shift + F3.
Our Data View window (panel) will now show on our desktop.
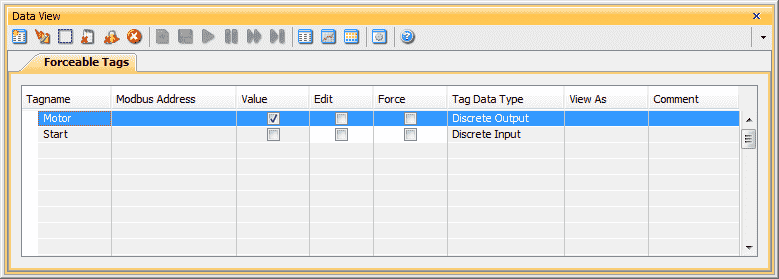
The Forceable Tags tab will be shown as the default. Some of the following parameters are shown.
Tagname – This is the name that we specified in the tag database
Modbus Address – If a modbus address was assigned in the tag database it would appear here.
Value – This is ON (Checked) or OFF (Unchecked)
Edit – The edit indicates the tagname to modify
Force – Forcing the tagname will either set or reset the current value of the bit.
Forcing the IO – Productivity Monitoring Program
We will force the Start bit by checking the Edit and Force.
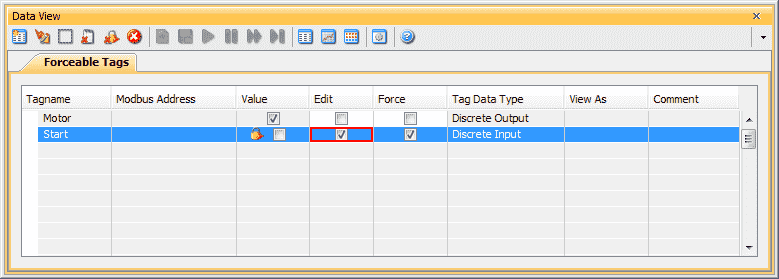
You will notice the lock next to the value. This indicates that the bit is forced. The actual input status does not matter. The force of the bit (on or off) will override.
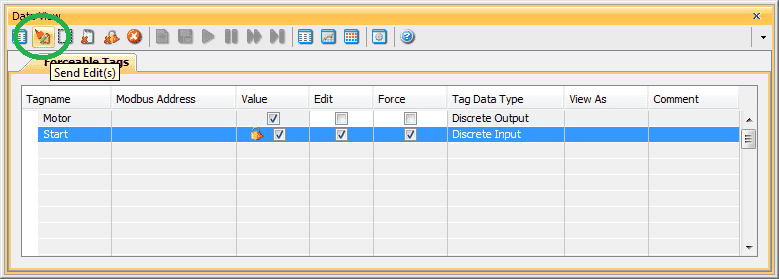
Clicking the Send Edit(s) icon will now set the force on the bit (Start) that we have selected.
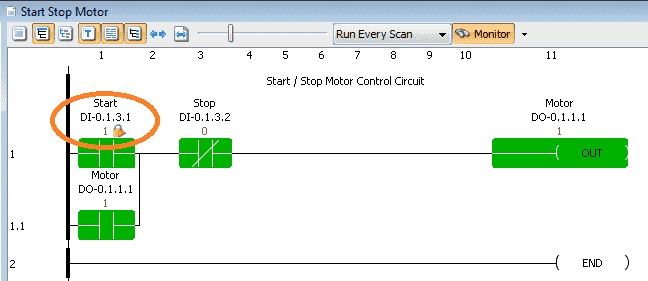
Our program will now show the forced bit by the lock icon next to the contact.
Selecting the Edit bit again for the Start and clicking the Send Edit(s) will force the bit off.
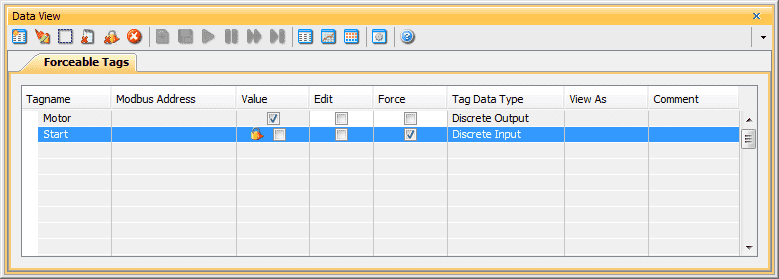
Our program will reflect the off condition of the force, but still show the start as being forced off by the lock icon.
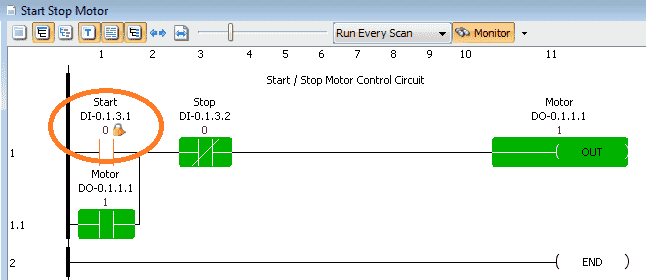
Monitor a rung in Data View
The productivity suite software will also allow us to create a data view tab by selecting the rung and right-clicking to show the menu.
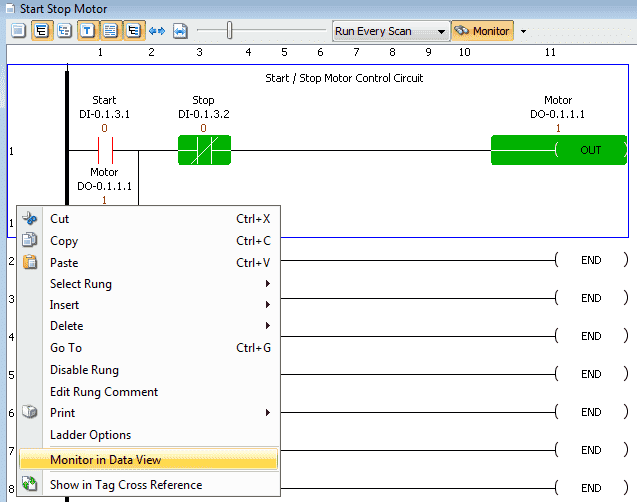
Select “Monitor in Data View”
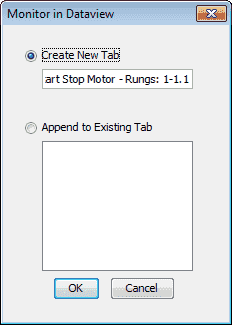
The above window will display allowing you to either create a new tab or append to an existing tab. This will allow us to join all of the tagnames together for a section of our program for testing and monitoring.
In our case, we will create a new tab. Select OK.
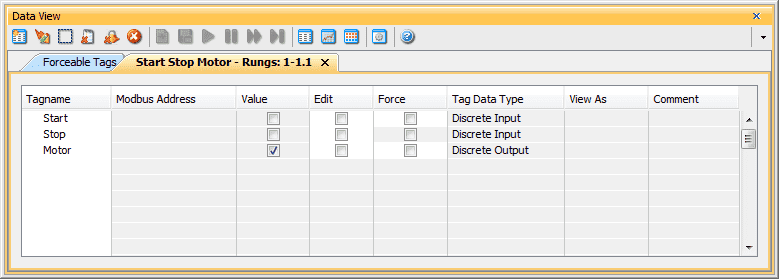
Our tagnames for our rungs are displayed in a new Data View tab.
IO View – Productivity Monitoring Program
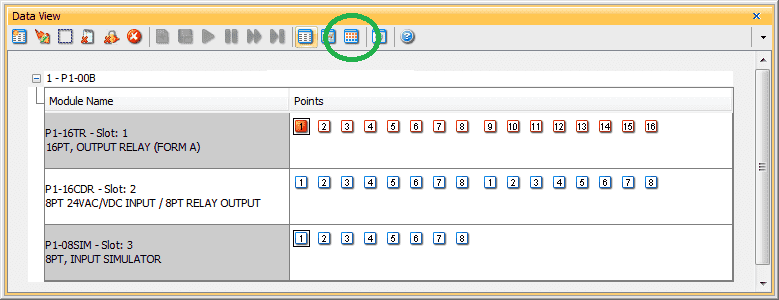
Toggle IO View will allow you to test all of your inputs and outputs of your system prior to running your program. You can view the inputs on/off and set the outputs by clicking on the output bit.
Graph View – Productivity Monitoring Program
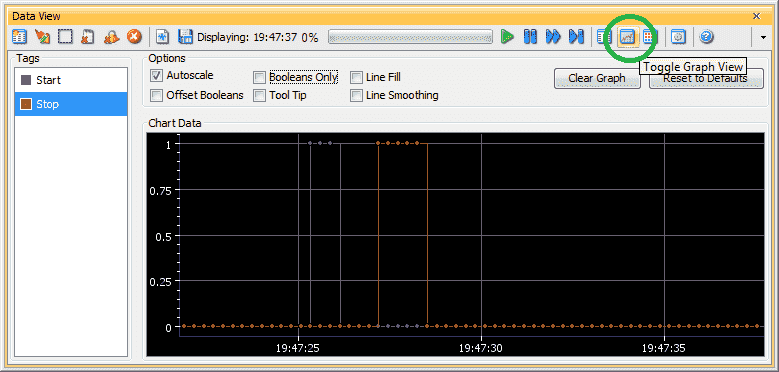
Toggle Graph View will allow you to graph the tag values. This is an excellent way of troubleshooting your PLC logic. See the help menu for all of the different options for the graphing functions.
Dataview Options…
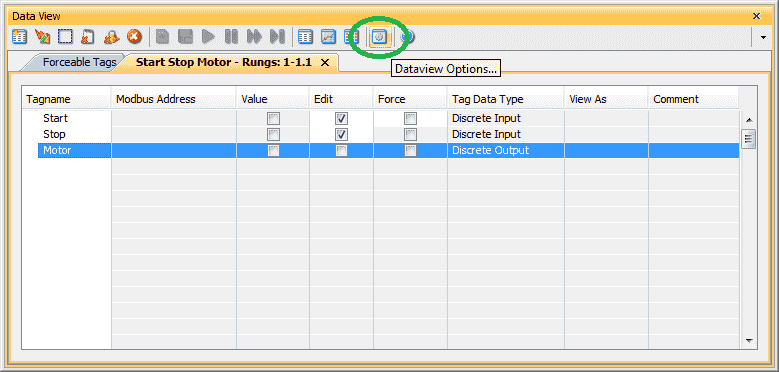
The data view options menu icon will bring up the Options window as we did at the beginning of this post. You can change different colors and options for the Data View window.
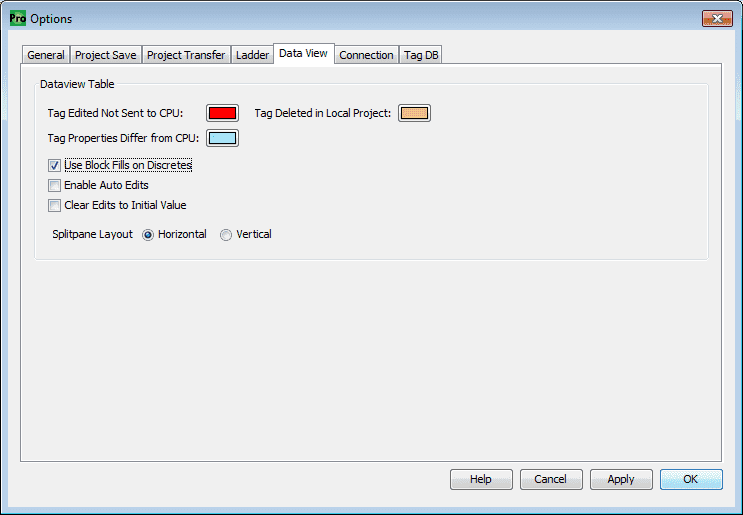
Select “Use Block Fills on Discretes” and click “Apply” and then “OK”.
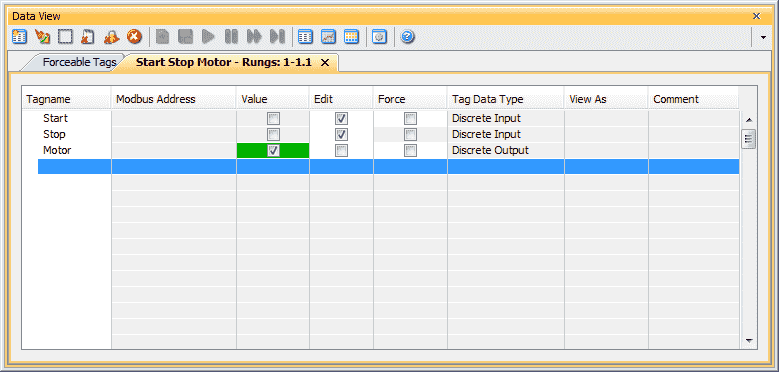
You will now see that the value when ON (checked) will be a solid green block.
Download our program here.
Watch the video below to see how we can monitor and test the program in our Productivity 1000 Series PLC.
Productivity 1000 Series PLC from Automation Direct
Overview Link (Additional Information on the Unit)
Configuration (Configure and purchase a system – BOM)
User Manual and Inserts (Installation and Setup Guides)
Productivity Suite Programming Software (Free Download Link)
This software contains all of the instruction sets and help files for the Productivity Series.
Next time we will look more at online editing and debug mode in the Productivity 1000 Series PLC.
Watch on YouTube : Productivity 1000 Series PLC – Monitoring and Testing the Program
If you have any questions or need further information please contact me.
Thank you,
Garry
If you’re like most of my readers, you’re committed to learning about technology. Numbering systems used in PLC’s are not difficult to learn and understand. We will walk through the numbering systems used in PLCs. This includes Bits, Decimal, Hexadecimal, ASCII and Floating Point.
To get this free article, subscribe to my free email newsletter.
Use the information to inform other people how numbering systems work. Sign up now.
The ‘Robust Data Logging for Free’ eBook is also available as a free download. The link is included when you subscribe to ACC Automation.

