The C-More Micro HMI Panel software uses virtual components called Objects. Meters and Graphs are part of these objects. They can represent a range of numbers and are programmable to simulate the functions that you require on your automation project. This helps you produce simple, intuitive looking human machine interfaces.
We will now look at the meters and graphs that we can use with our HMI micro panel. They can replace the older chart recorder equipment that is still in use in some manufacturing facilities. These objects will represent the data in the PLC for the user to interpret. Let’s get started.
Previously in this C-More Micro HMI Panel series we have done the following:
System Hardware – Video
Installing the Software – Video
– Update Automation Direct Software C-More Micro HMI Video
System Setup Screens – Video
First Program – Video
First Program Part 2 (PLC < – > Panel) – Video
Common Screen Menu – Video
Simulate Project – Video
Object List Shapes – Video
Object Buttons and Indicators – Video
Object Numeric Entry – Video
C-More Micro – Setting Our Graphs and Meters Pages
We will be using the program we created last time. (C-More Micro HMI Object Numeric Entry).
Under the Navigation panel we will create a new screen. (Screen 6)
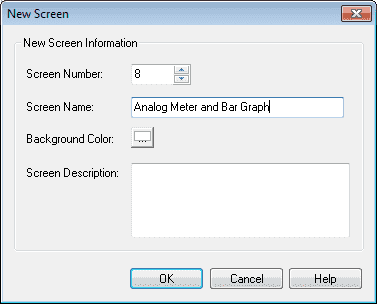
On the screen tab under the navigation panel select New Screen. (Ctrl + N)
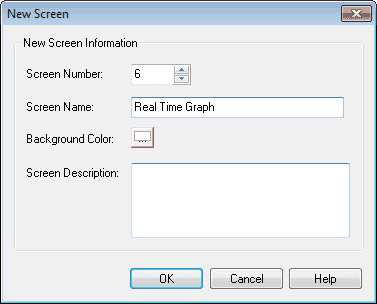
Screen Name: Real Time Graph
Screen Description – We can describe the purpose of the screen.
Select OK.
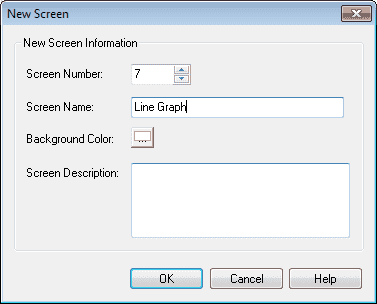
Repeat the above procedure for Screen 7 – Line Graph
Repeat the above procedure for Screen 8 – Analog Meter and Bar Graph
Set the background screen for our new pages to page 100. This was first shown in the post Common Screen Menu – Video.
Select the “Screen Selector” button on screen 100. Add the three new screens so we can navigate to them.
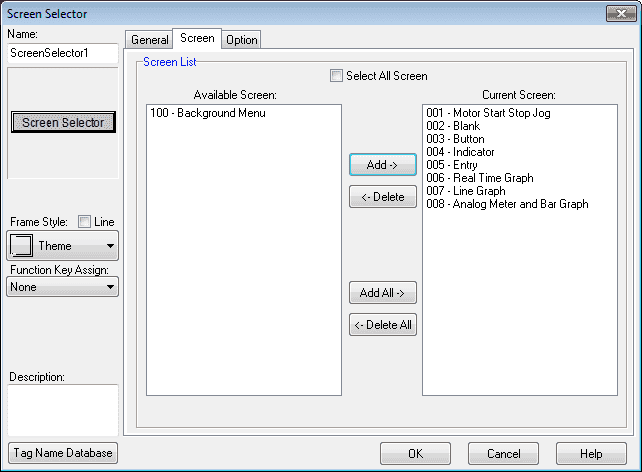
We now have our pages to start adding meters and graphs.
Tag Name Database – C-More Micro
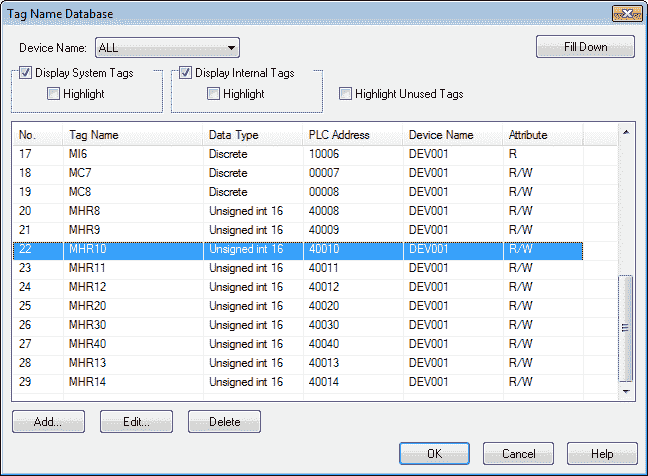
We will use the following addresses to control the Graph and Meter objects on the cmore micro HMI. Add this to our tag database.
MHR10 – Modbus Address 40010 – 16 bit unsigned – Read / Write (Real Time Graph – Pen 1)
MHR11 – Modbus Address 40011 – 16 bit unsigned – Read / Write (Real Time Graph – Pen 2)
MHR12 – Modbus Address 40012 – 16 bit unsigned – Read / Write (Real Time Graph – Pen 3)
MHR20 – Modbus Address 40020 – 16 bit unsigned – Read / Write (Line Graph – Pen 1 Range MHR20 – MHR29)
MHR30 – Modbus Address 40030 – 16 bit unsigned – Read / Write (Line Graph – Pen 2 Range MHR30 – MHR39)
MHR40 – Modbus Address 40040 – 16 bit unsigned – Read / Write (Line Graph – Pen 3 Range MHR40 – MHR49)
MHR13 – Modbus Address 40013 – 16 bit unsigned – Read / Write (Analog Meter)
MHR14 – Modbus Address 40014 – 16 bit unsigned – Read / Write (Bar Graph)
C-More Micro – Real-Time Graphs
The Real Time Graphs Object is used to monitor up to 8 different tag names. We can view up to 24 points for the duration selected. The values displayed are not stored in the panel. The real time graphs object will begin a new display each time the screen with this object is accessed.
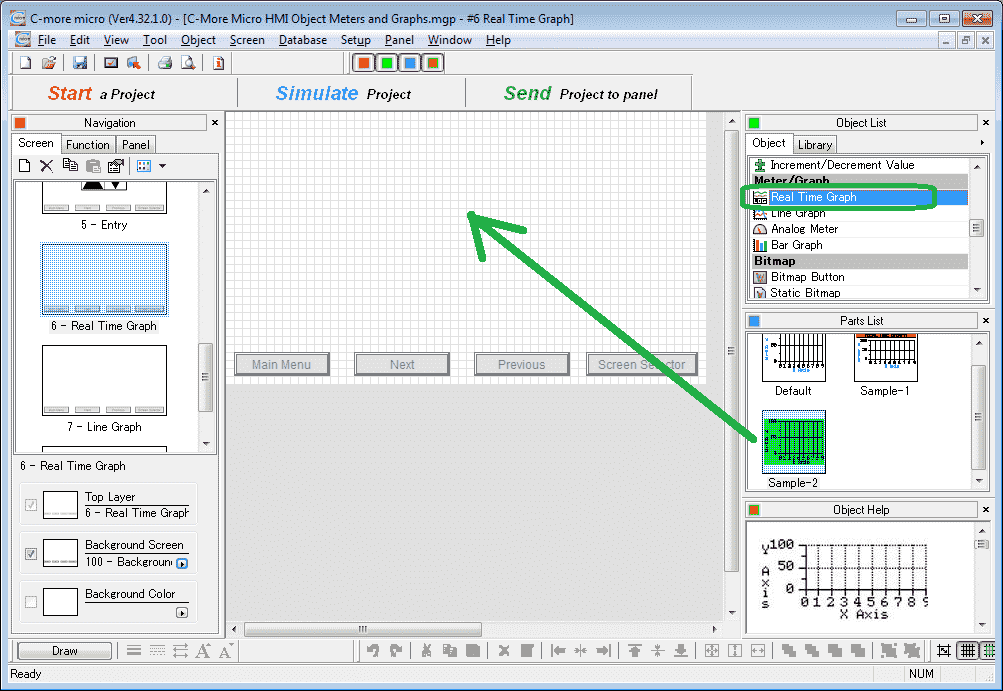
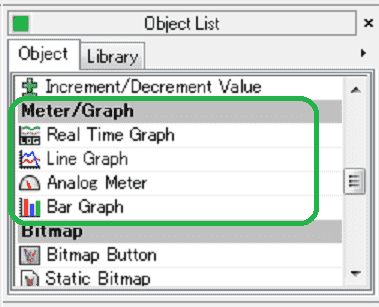
Select screen 6 from the navigation window. Select Real Time Graph under the Meter/Graph heading in the Object list. Now click and hold Sample-2 from the parts list and drag onto our screen.
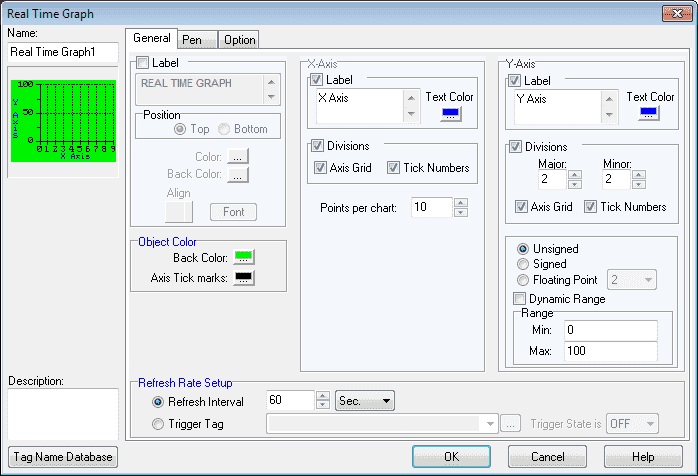
Name: – The default name is Real Time Graph1. Change the name on the field by clicking and typing a new name.
Object Preview Window: – This is a smaller display of what the changes are as you make them on the Real Time Graph window.
Description: – Enter up to 400 characters to describe this real time graph object.
Tag Name Database: – This button allows you to add, edit or delete tag names.
Label: – This is the display title of the real time graph.
Object Color: – This is the background colour and axis tick mark colour of the graph.
X-Axis / Y-Axis – These are the labels for the x and y axis. You can change the colour of the label and grid for each.
Points per chart: – You can select from 4 to 24 points to display per chart.
Dynamic Range: – The range of values displayed on the y-axis can be entered as a minimum and maximum value or if the dynamic range is checked the values stored in the tags determine the minimum and maximum.
Refresh Rate Setup
Refresh Interval: – The amount of time between the points on the graph
Trigger Tag: – If selected this discrete (on/off) tag when triggered will add points to the graph.
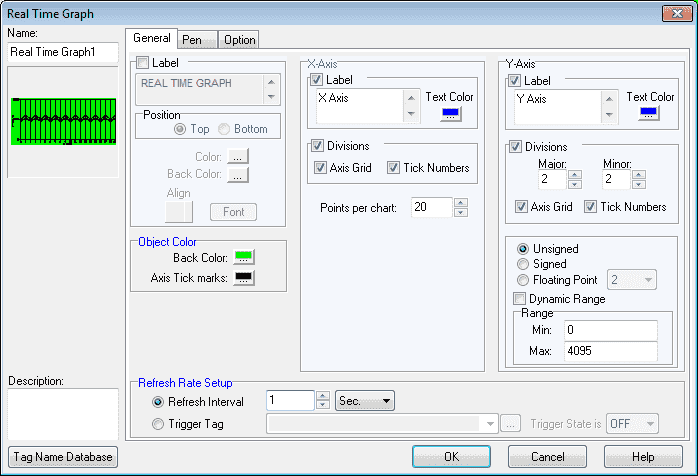
In our example we will leave everything as the default except for the following:
Points per chart – 20
Refresh Interval – 1 second
Range – Min: 0 Max: 4095 (This is the resolution on our analog input from the PLC Simulator)
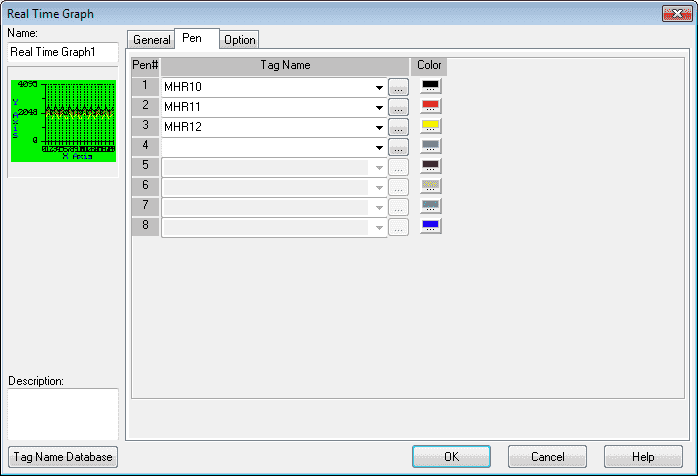
Under the Pen tab we can set up to eight different tags to represent on our graph. Each tag can be a different colour. We will use MHR10, MHR11 and MHR12 for our three different values.
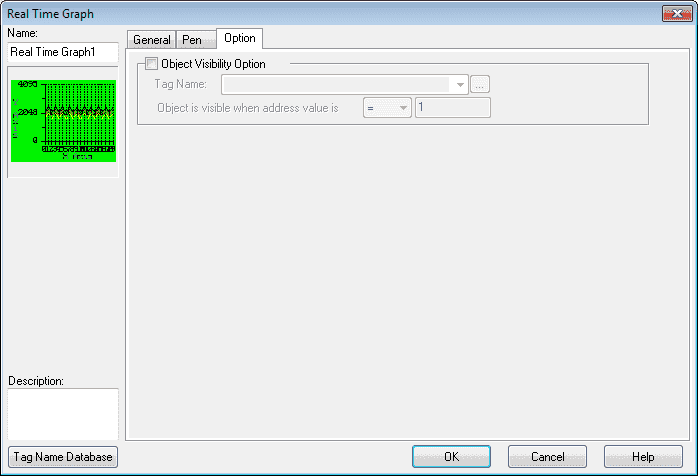
The option tab is for the visibility of the object. In our case we will leave this as the default. (Not selected)

We can now position and resize the real time graph object on our screen using our mouse.
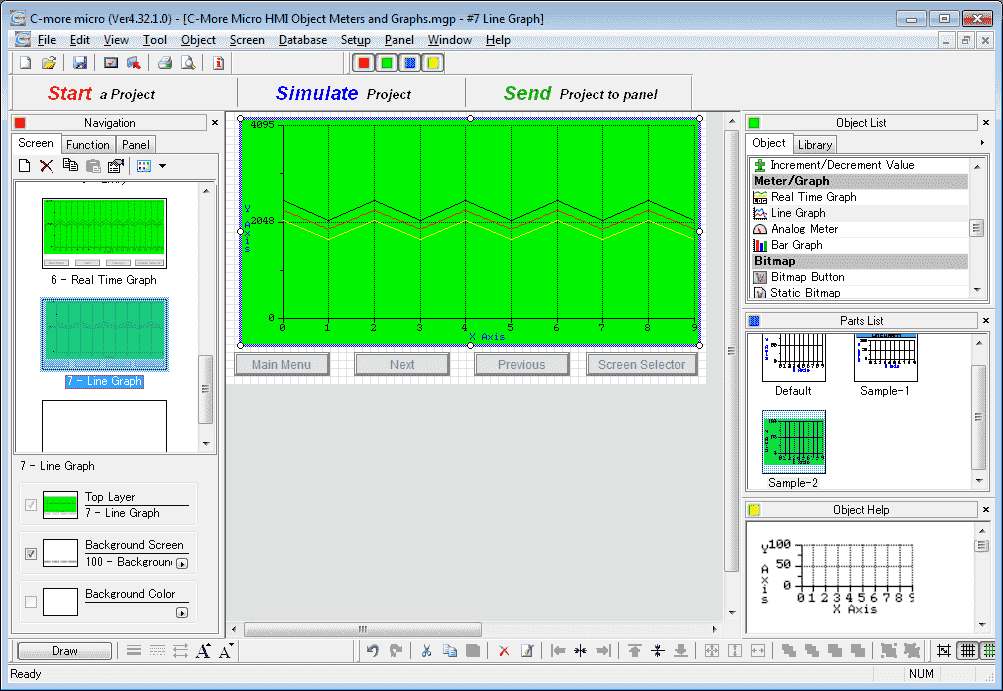
Line Graphs – C-More Micro
The line graph object displays the values in a block of memory locations. The block of memory can be from 4 to 24 consecutive registers. We can display up to 8 different blocks of memory on the line graph.
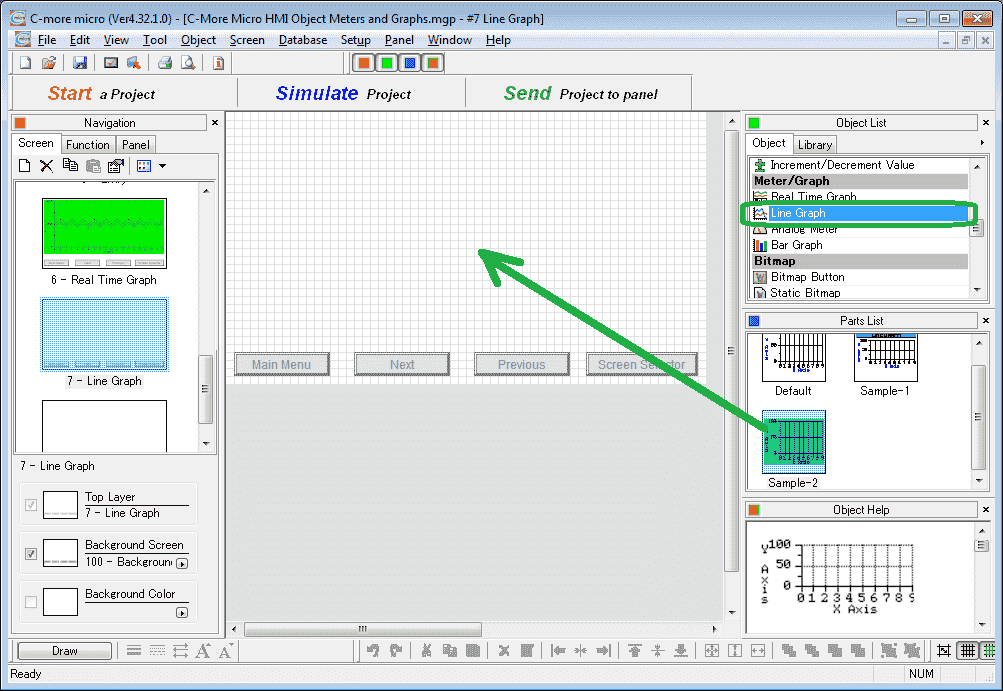
Select screen 7 from the navigation window. Select Line Graph under the Meter/Graph heading in the Object list. Now click and hold Sample-2 from the parts list and drag onto our screen.
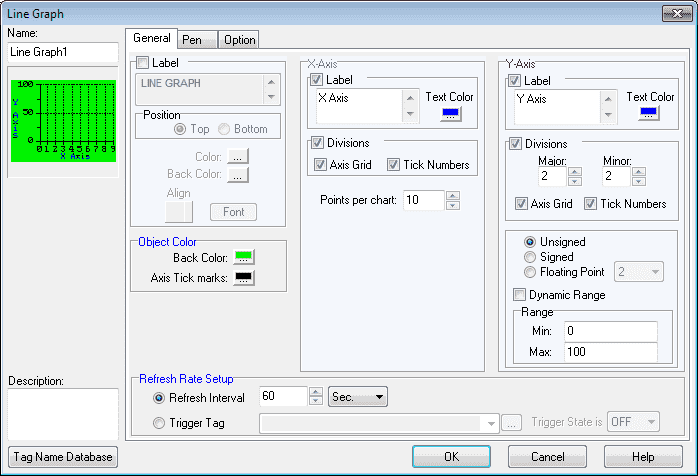
The options in our Line Graph window are similar to the Real Time Graph discussed above.
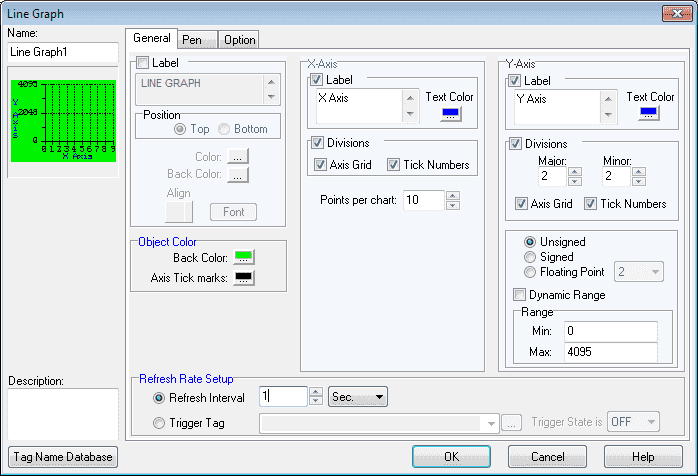
We will change the refresh interval to 1 second. The min will be set for 0 and the max to 4095. Our default points per chart will be left at the value of 10. This represents the amount of registers that we will be reading for each of our lines on the graph.
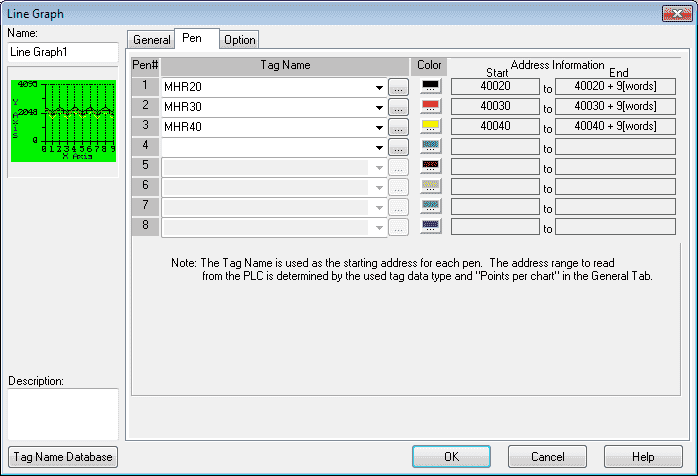
Under the Pen Tab we will set up the tag names to be displayed on our line graph. We can have up to 8 different pen numbers on the graph. Each tag name will set up a group of 10 consecutive memory locations. In our case we have the following:
MHR20 = 40020 to 40029 (Modbus Address)
MHR30 = 40030 to 40039 (Modbus Address)
MHR40 = 40040 to 40049 (Modbus Address)
Select OK.
We can now position and resize the line graph object on our screen using our mouse.
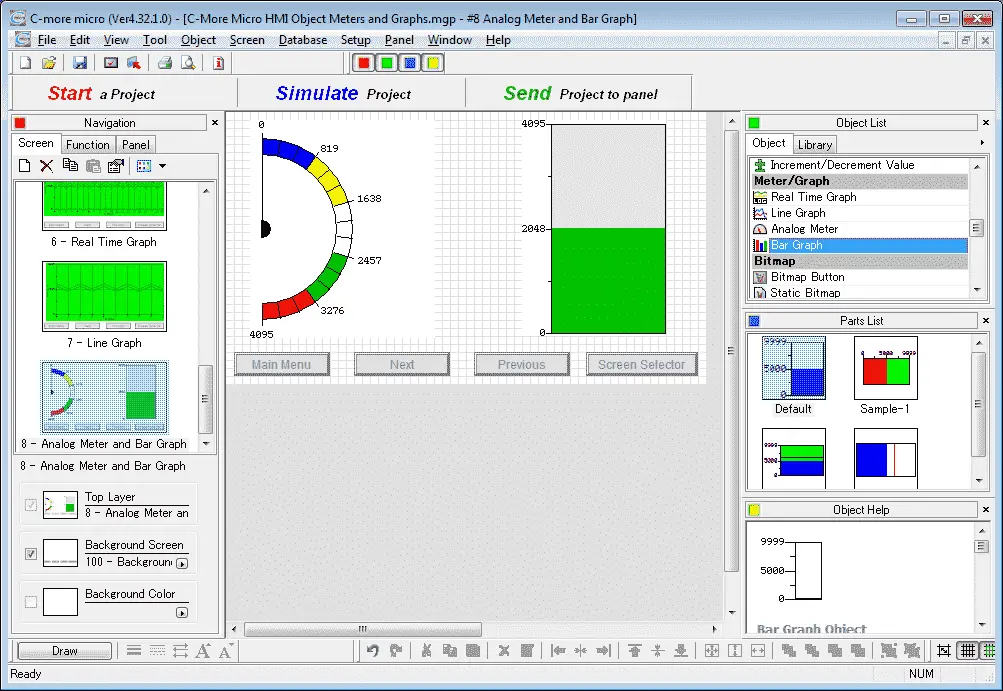
Analog Meter – C-More Micro
The analog meter object is used to monitor an assigned tag name. This can be used to create digital versions of current or voltage meters or gauges that represent level, speed, flow, etc.
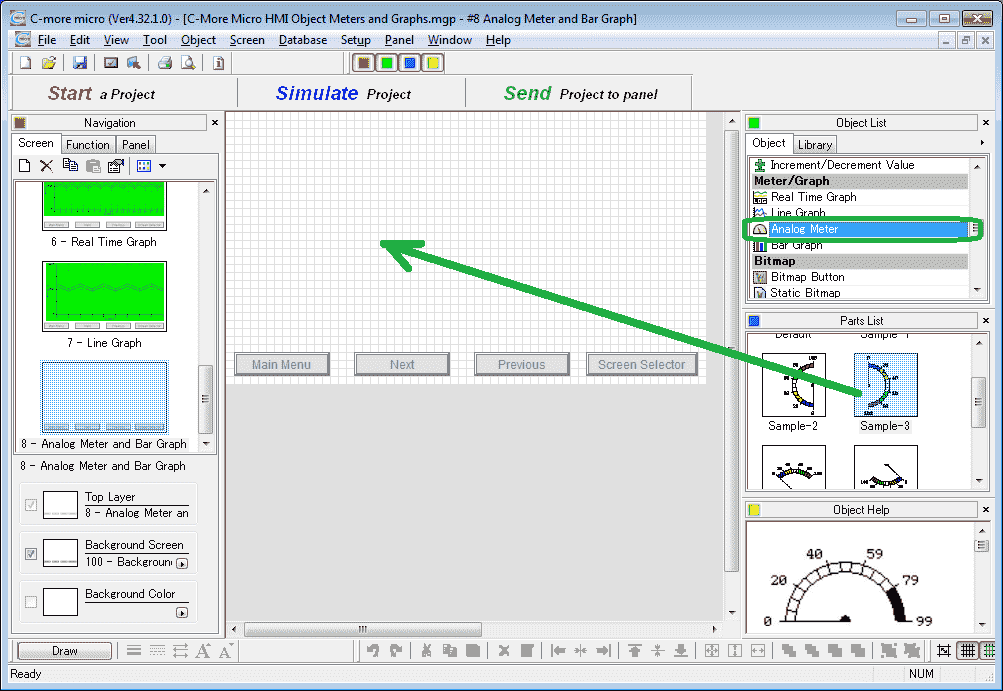
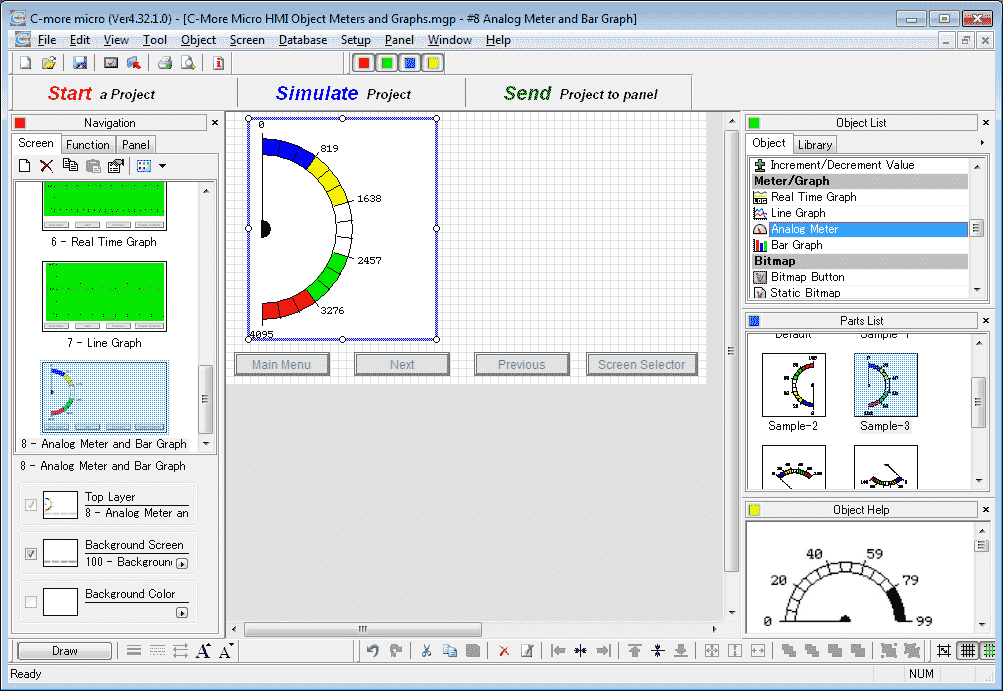
Select screen 8 from the navigation window. Select Analog Meter under the Meter/Graph heading in the Object list. Now click and hold Sample-3 from the parts list and drag onto our screen
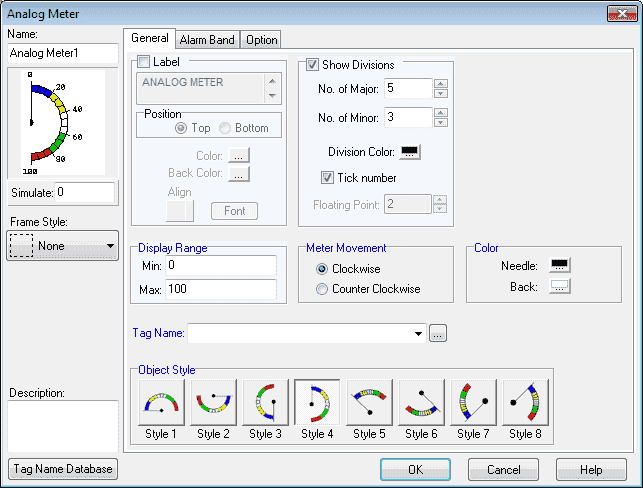
On the Analog Meter window we can set up the parameters that we want for our object. These parameters are similar to the ones we have covered before. Notice the amount of different object styles that you may select.
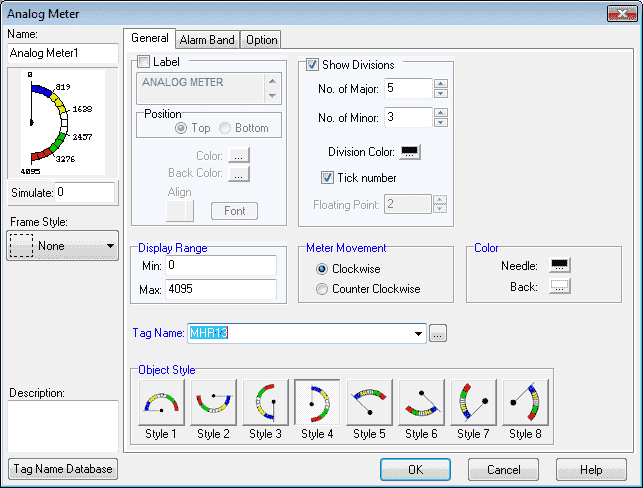
We will set the display range min-0 max-4095. The tag name will be MHR13 – 40013 (Modbus)
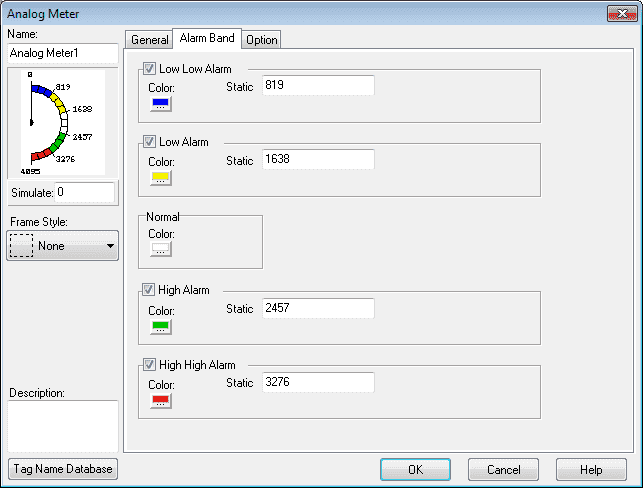
Under the Alarm Band tab we can set up the different alarm ranges. You can unselect any range if you do not want it to show on your display. Select OK.
Position and resize the analog meter object on your screen using a mouse.
Bar Graph – C-More Micro
The bar graph is used to display variable data from a tag name. This data can represent numerous items like pressure, flow, volume, levels, etc.
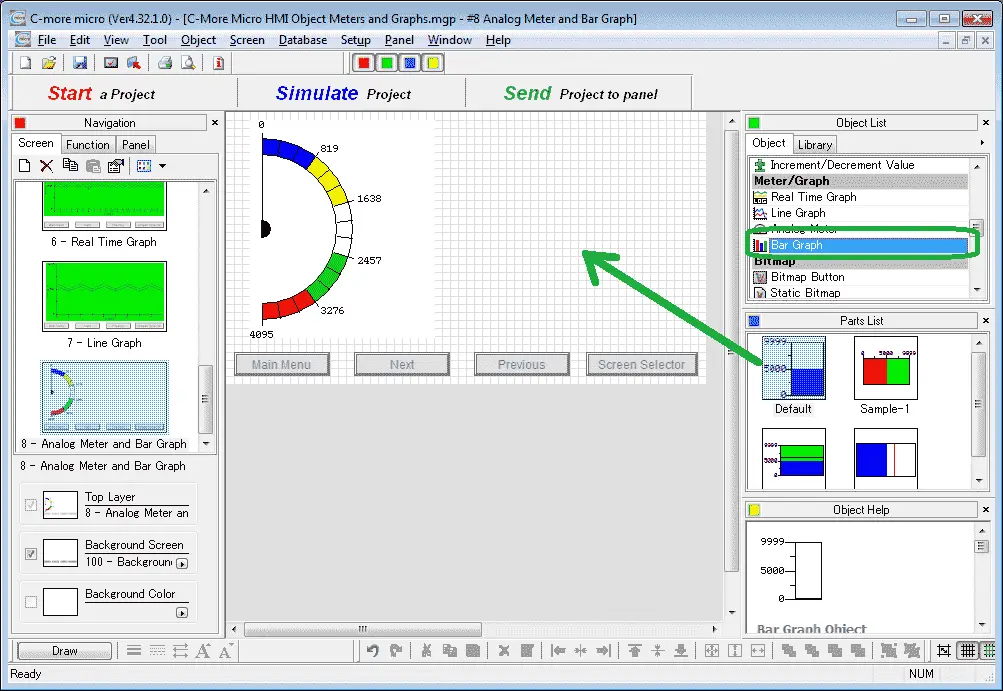
We will add our bar graph to screen 8. Select Bar Graph under the Meter/Graph heading in the Object list. Now click and hold Default from the parts list and drag onto our screen.
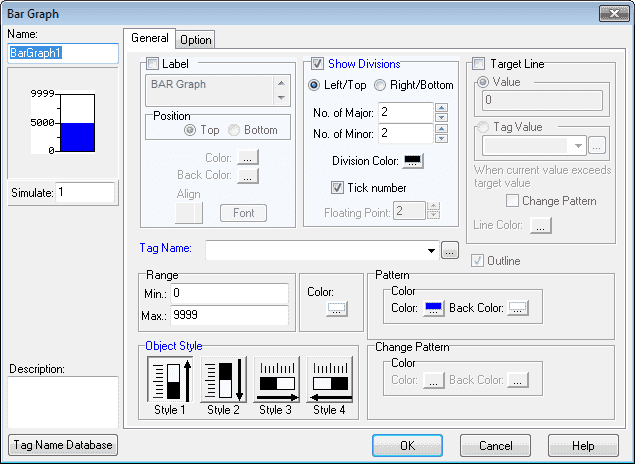
The bar graph window will have similar parameters that we have discussed before.
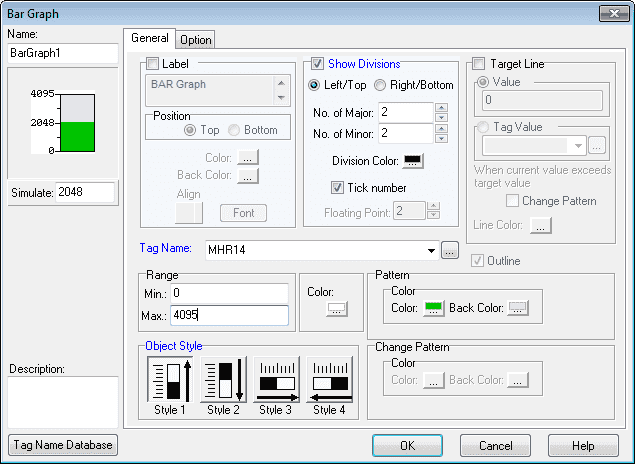
We will change the range from 0 to 4095 to represent our analog input value. Our pattern will be a green on a grey background. The tag name will be MHR14 – 40014 (Modbus Address). Select OK.
Position and resize the bar graph object on your screen using a mouse.
PLC Program Additions – C-More Micro Meters and Graphs
Using the program we previously developed, we will add additional rungs to the program for our Meter / Graph Objects.

WX0 to WX2 get moved to MHR10 to MHR12. This will be the logic for our real time graph.
Our line graph uses blocks of memory. We will set this memory using the Data View of our Do-More Designer Simulator.
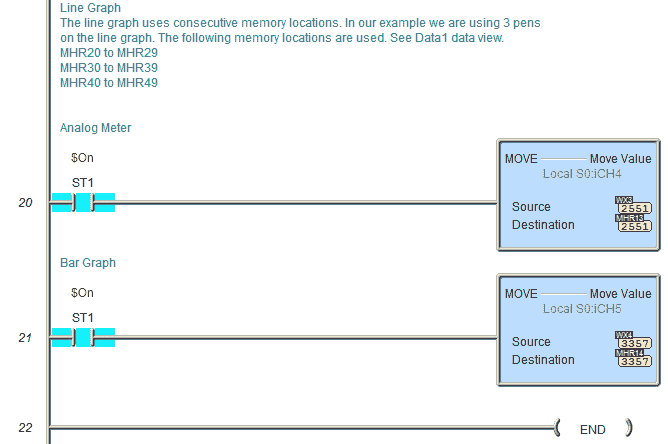
WX3 is moved to MHR13. This will represent our analog meter value.
WX4 is moved to MHR14. This will represent our bar graph value.
Download the PLC and C-More Micro program here.
Watch the video below to see the Meter and Graph Objects in action on our C-More Micro HMI Panel. This will also demonstrate the PLC ladder code for functionality and the simulator.
C-More Micro Panels from Automation Direct
https://www.automationdirect.com/adc/Shopping/Catalog/HMI_(Human_Machine_Interface)/C-more_Micro_Panels
C-More Micro – Graphic Panel (EA3 Series) User Manual and Quick Start Guides
https://cdn.automationdirect.com/static/manuals/ea3mguserm/ea3mguserm.html
EA3-T4CL C-More Micro Specifications
https://cdn.automationdirect.com/static/specs/ea3t4cl.pdf
C-More Micro Programming Software V4.30
http://support.automationdirect.com/products/cmoremicro.html
This free software will enable you to program all of the C-More Micro HMI units. It includes a simulator for your application.
Next time we will look at bitmap objects in the C-More Micro HMI Panel.
Watch on YouTube: C-More Micro HMI Object Meters and Graphs
If you have any questions or need further information please contact me.
Thank you,
Garry
If you’re like most of my readers, you’re committed to learning about technology. Numbering systems used in PLC’s are not difficult to learn and understand. We will walk through the numbering systems used in PLCs. This includes Bits, Decimal, Hexadecimal, ASCII and Floating Point.
To get this free article, subscribe to my free email newsletter.
Use the information to inform other people how numbering systems work. Sign up now.
The ‘Robust Data Logging for Free’ eBook is also available as a free download. The link is included when you subscribe to ACC Automation.