We will now look at the C-More EA9 meters and graphs that we can have on our HMI. The C-More HMI Panel software uses virtual components called Objects. These objects are programmable to simulate the functions that you require on your automation project. Pushbuttons, Switches, meters, and graphs are just a few of the objects that are available to you.
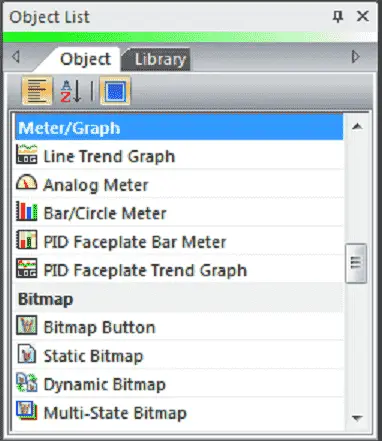
We will now look at the object list meters and graphs that we can use with our HMI panel. The meter and graph objects that are available on the C-More EA9 are Line Trend Graph, Analog Meter, Bar/Circle Meter, PID Faceplate Bar Meter, and PID Faceplate Trend Meter. Let’s get started.
Previously in this C-More EA9 HMI Panel series, we have done the following:
System Hardware
– Unboxing and Review Video
– Powering the Unit Video
Installing the Software – Video
System Setup Screens – Video
First Program
– Establishing Communication and Updating Firmware Video
– First Program Video
Panel to PLC and PLC to Panel Settings – Video
Common Screen Menu – Video
Simulate Project – Video
Object List Shapes – Video
Object List Buttons – Video
Object List Indicators – Video
Object List Entry – Video
Watch the video below to see the Object List Meters and Graphs in action on our C-More EA9 HMI Panel.
Setting Our Meter Graph Screen – C-More
We will be adding to the program we created last time. (C-More EA9 HMI Series Panel Object List Entry).
Select a new screen under the main menu | Screen | New Screen…
Alternatively, we can also use the icons in the Navigation panel.
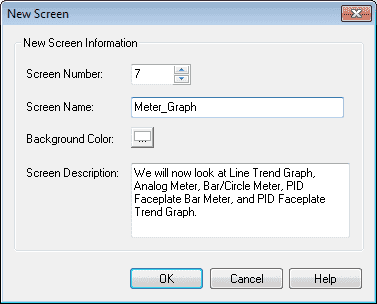
We will name screen 7; Meter_Graph. The screen description can be used to describe the screen. Hit OK.
Our new screen will now be displayed.
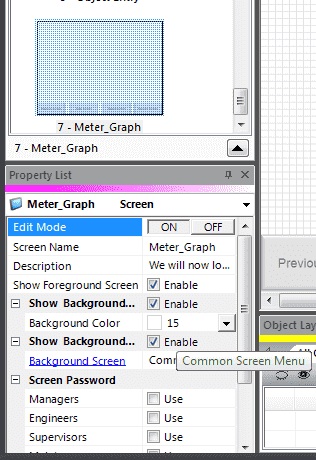
Under the property, list window turn on the editing and enable the show background. Select Common Screen Menu under the background screen. Turn off the edit mode under the property list.
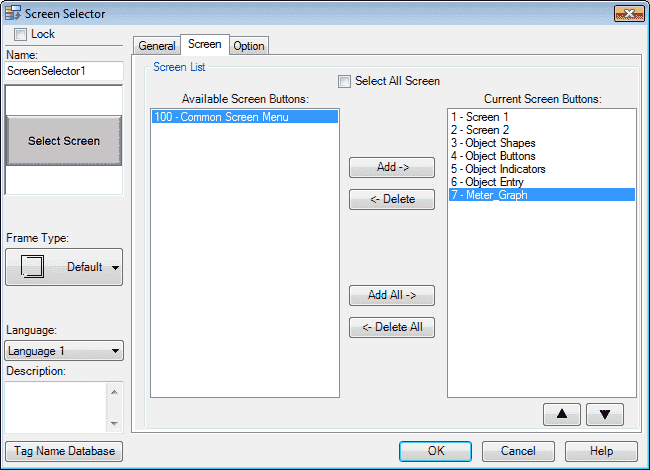
We must now add our new screen so we can select it when using the common screen menu. Select page 100. Select the Screen Selector button. Under the Screen tab, select the 7 – Meter_Graph and hit the Add button so it moves it over to the Current Screen Buttons. Hit OK. We can now go back to our newly created Object Indicators screen page 7 from our navigation window.
Our new screen is now ready for us to add our indicators.
Tag Name Database – C-More
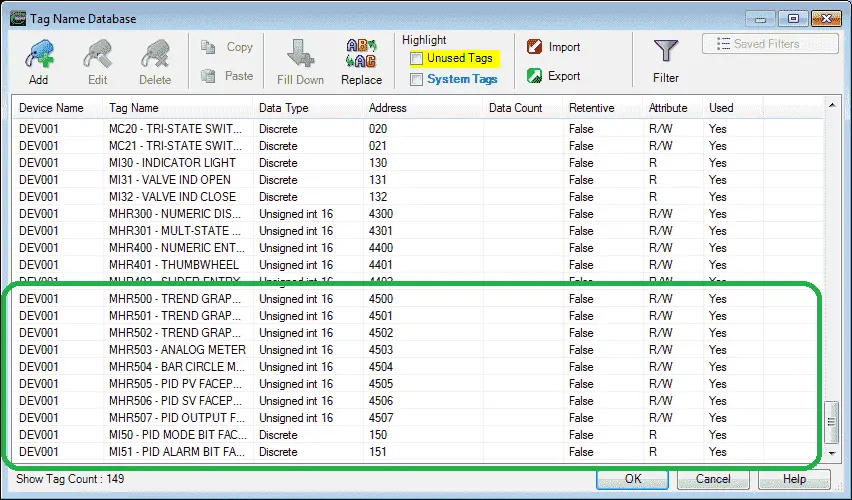
We will use the following addresses to control the Meter and Graph objects on the cmore HMI.
MHR500 – Unsigned Int 16 – Modbus Address 40500 – Read / Write (Trend Graph Pen 1)
MHR501 – Unsigned Int 16 – Modbus Address 40501 – Read / Write (Trend Graph Pen 2)
MHR502 – Unsigned Int 16 – Modbus Address 40502 – Read / Write (Trend Graph Pen 3)
MHR503 – Unsigned Int 16 – Modbus Address 40503 – Read / Write (Analog Meter)
MHR504 – Unsigned Int 16 – Modbus Address 40504 – Read / Write (Bar Circle Meter)
MHR505 – Unsigned Int 16 – Modbus Address 40505 – Read / Write (PID PV Faceplate)
MHR506 – Unsigned Int 16 – Modbus Address 40506 – Read / Write (PID SV Faceplate)
MHR507 – Unsigned Int 16 – Modbus Address 40507 – Read / Write (PID Output Faceplate)
MI50– Discrete On/Off – Modbus Address 10050 – Read (PID Mode Bit Faceplate)
MI51– Discrete On/Off – Modbus Address 10051 – Read (PID Alarm Bit Faceplate)
Meters and Graphs Object – C-More
Meters are used to quickly see the values in the PLC. The format will give a visual interpretation of the data on the screen. Graphs are used to visually illustrate the relationships of the data on the HMI screen. This takes up less space and is easier than describing the values with text alone. The control of these tags is done with the HMI panel and communicated to the PLC program.
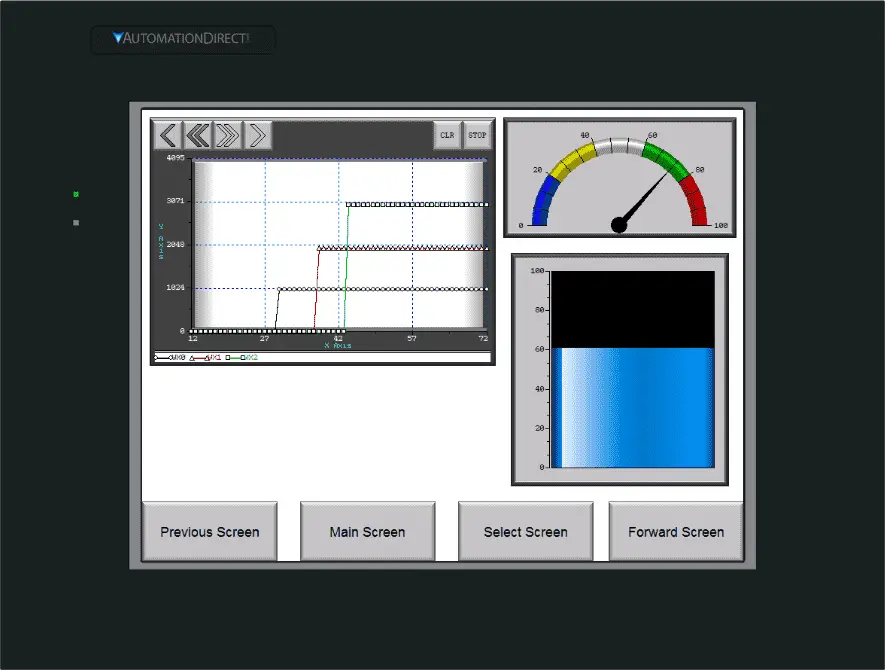
C-More Line Trend Graph
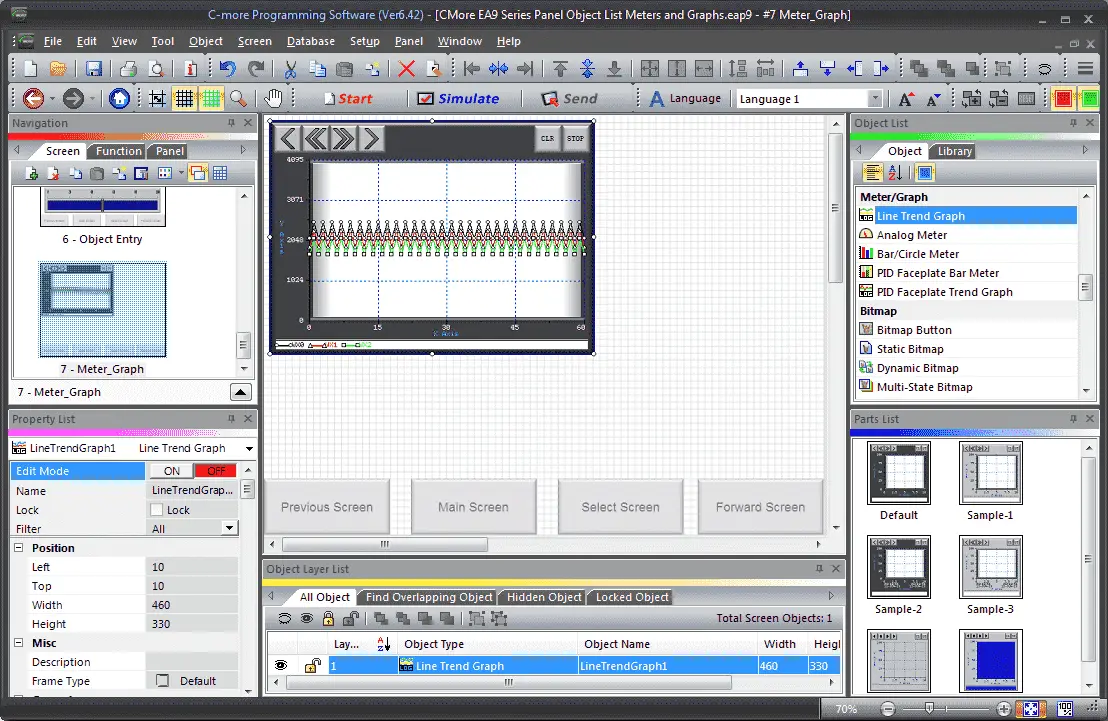
Select Screen 7 from the navigation window. We will now add a Line Trend Graph under the Object list window. Left click (hold) and drag the Default under the Parts List for the Line Trend Graph onto the screen.
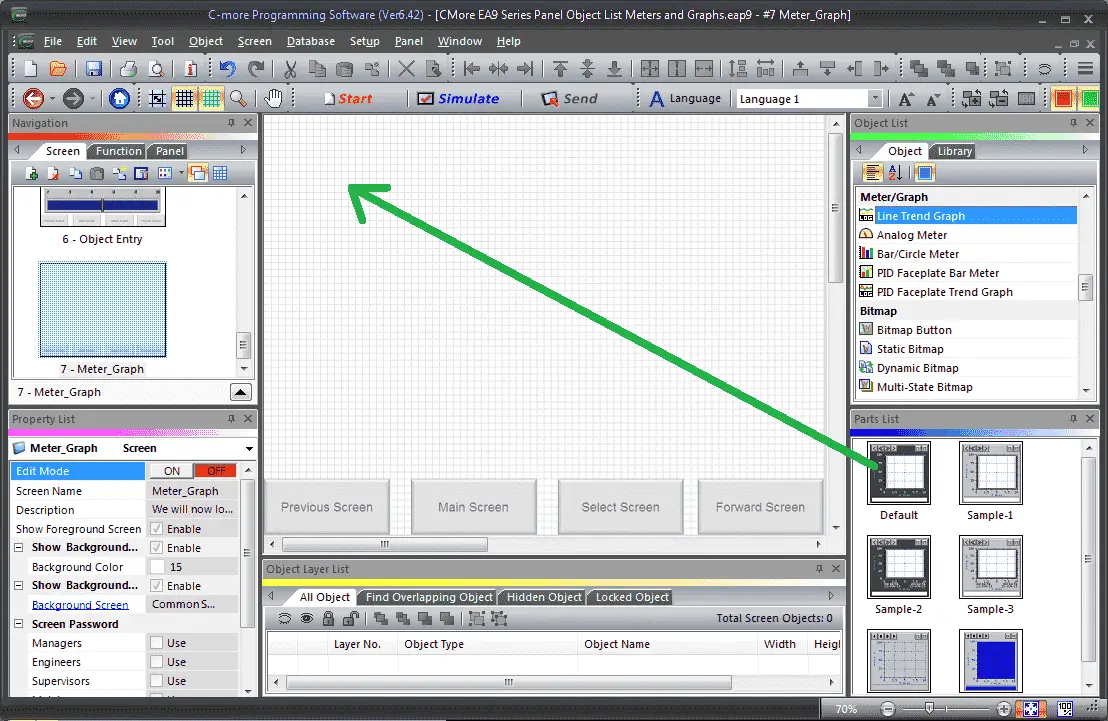
Note: Choose a preconfigured part from the Parts List window for the object selected. This will save time when configuring objects. Click and drag the item from the parts list to the screen. All of the objects will have a parts list.
The Line Trend Graph window will display. You can also use the main menu | Object | Meter/Graph | Line Trend Graph… and click on the work area of the screen. This will give you the default line trend graph selection.
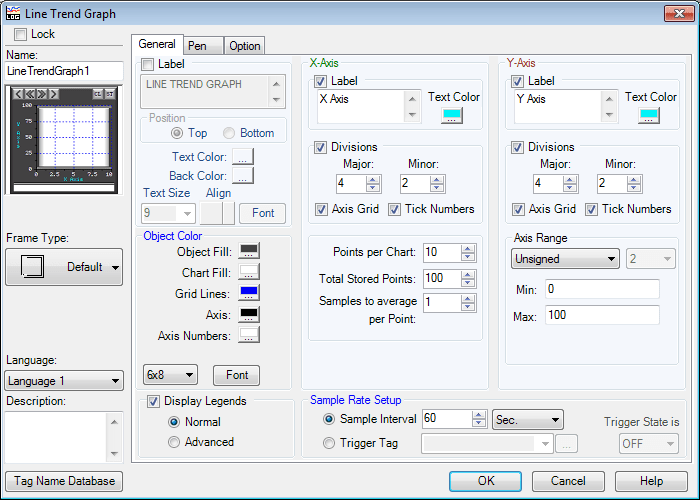
The following parameters can be set:
Name: This is the name of the object. The default is LineTrendGraph1
Object Preview Window: This will show what the object will look like on the screen.
Frame Type: The line trend graph object can be displayed in a series of frames. We will leave this as the default value.
Language: We will leave this as our default Language 1.
Description: We can enter up to 400 words to describe the purpose of the numeric entry that we are programming.
Tag Name Database: This will open a window that allows you to add, edit or delete tag names.
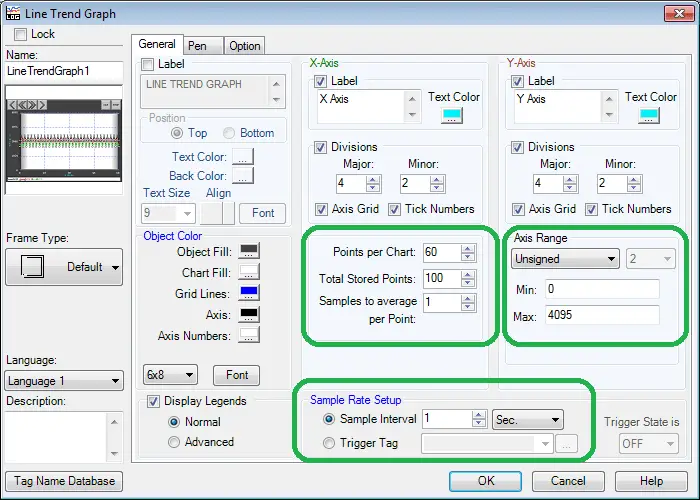
General Tab
Label: This will add a label to the line trend graph. We will not select this and leave the default name of LINE TREND GRAPH in the label text field.
Object Color – This will allow us to change the Object Fill, Chart Fill, Grid Lines, Axis, and Axis numbers colour. We will leave this as their default.
We will also leave the default size and font.
The Display Legends will be checked as a default and the Normal will be selected.
X-Axis and Y-Axis
We can change various things on our axis. The labels, text colour, divisions major and minor, axis grid and tick numbers will be left in their default states.
Points per Chart – We will change this to 60 so we will see 60 points on the graph.
Total Stored Points – This is the number of points that will be stored in the HMI so you can go back and review on the graph. We will leave this as the default value.
Samples to average per point – This is the average of the value to filter out noise on the line before displaying on the HMI. We will leave this as the default value.
Axis Range – We will set this to Unsigned values and have a minimum of 0 and a maximum of 4095. This is the settings from our inputs from the PLC simulator on the Do-More Designer software.
Sample Rate Setup
We will set our sample rate up for 1 second. This means that with 60 points we will see 1 minute of data on our screen. You can also set this up to sample based on a trigger. This would be useful to track occurrences that are not always linear in fashion.
Select the Pen tab.
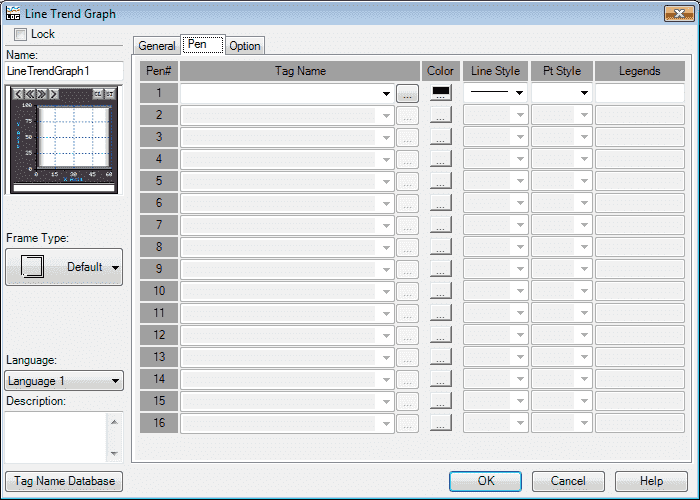
This is where we will set our Pens. We can set 16 points to monitor on our graph. Colour, Line Style, Point Style, and Legend can be set for each of the pens that we select.
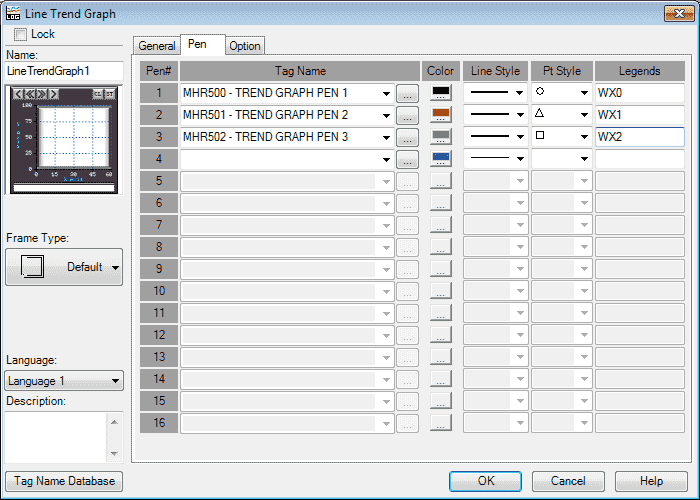
Here are our three pens that we will use on our graph.
Select the Options tab.
Option Tab
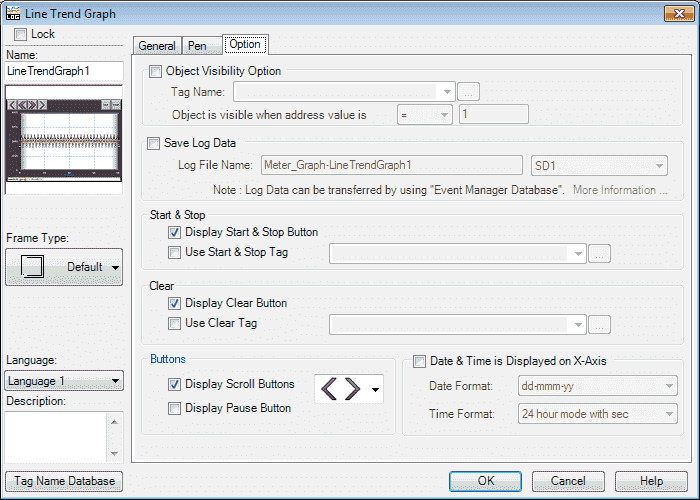
Object Visibility Option: We can use this selection to configure a tag to control when the object appears on the screen. C-More EA9 HMI Series Panel Object List Shapes – Video will demonstrate how we use this option.
Save Log Data: We can use this selection to save our data to a file. This can be saved to internal or external memory like a USB.
Start & Stop: We can choose whether to display or not the Start and Stop buttons on the graph. A tag in the PLC can also be used to start and stop the graph.
Clear: We can choose to display a clear button on the graph which can also be a tag in the PLC.
Buttons:
We will use the Display Scroll Buttons. You will see that there are a couple of different options for the symbols on the graph.
Date & Time is Displayed on X-Axis: We can select this to display the real-time clock of our points being monitored on the graph. When the point is displayed the actual time of the point will be displayed. See the help file for more information.
Click OK.
We can now position and resize the line trend graph object on our screen using our mouse.
C-More Analog Meter
The Analog Meter Object is used to monitor an assigned Tag Name continuously. This Object can be used to create digital versions of level, current, and flow meters to name a few samples, or gauges that measure speed and other measurable data.
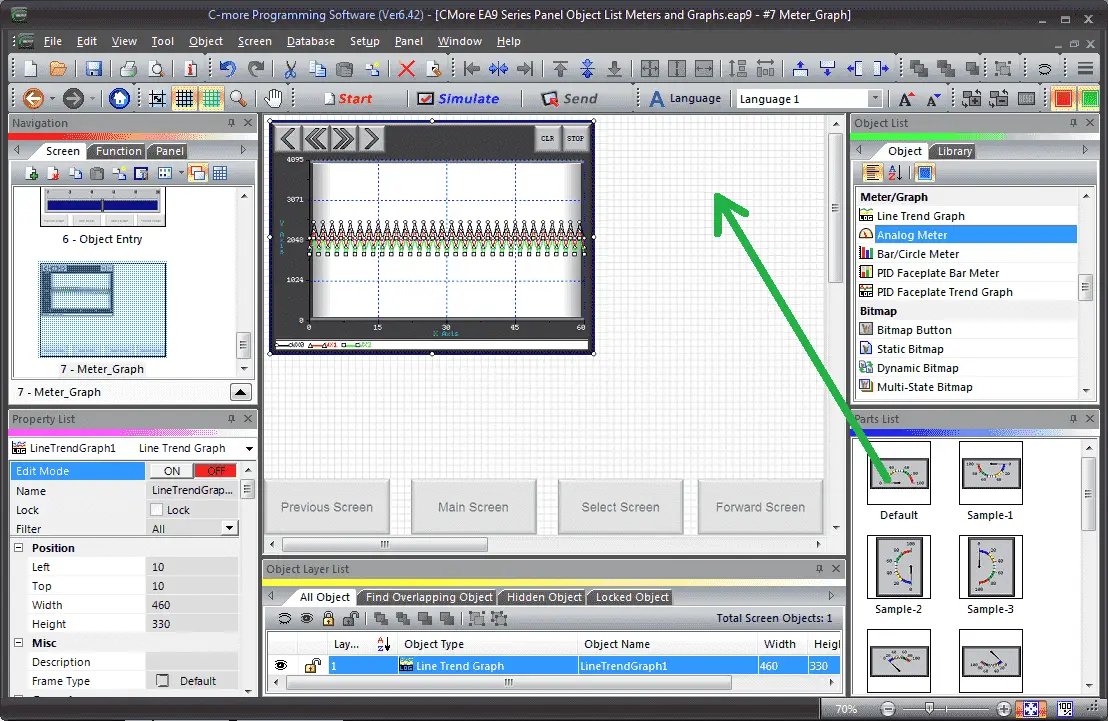
Select Analog Meter from the Object List under Meter/Graph. Now click and hold Default from the parts list and drag onto our screen.
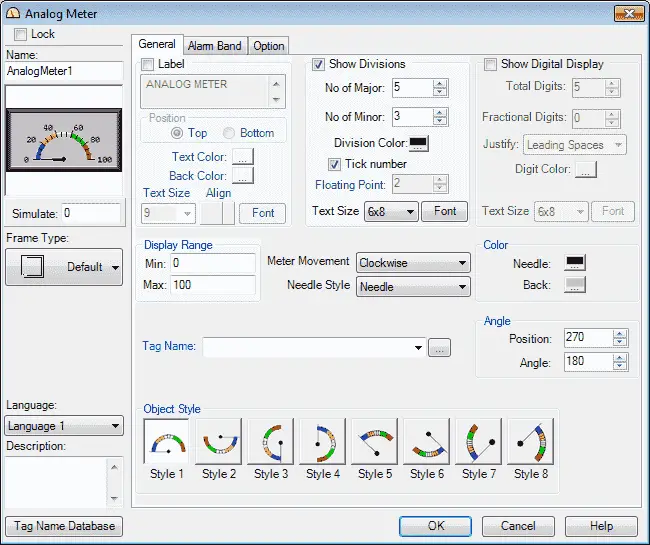
The Analog Meter window now appears. This is similar to many of the items that we have already programmed previously.

The Tag Name will be MHR503 (Modbus Address 40503). We will leave all of the other settings as their default. Note: The Display Range will go from 0 to 100.
Select the Alarm Band tab.
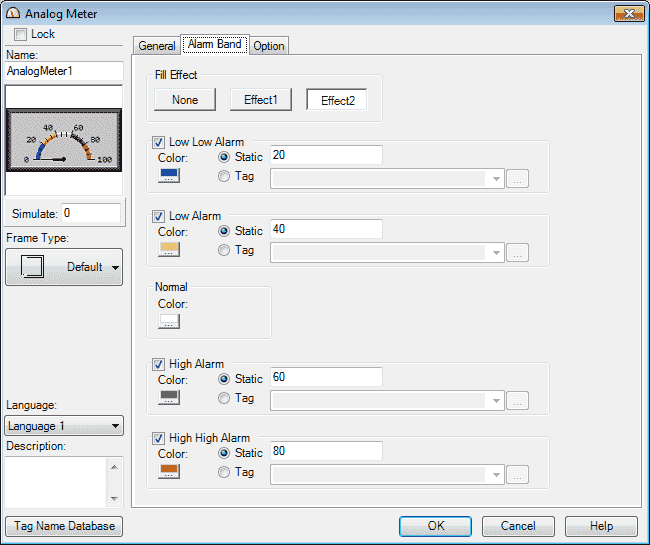
We can set the Low Low Alarm, Low Alarm, High Alarm or High High Alarm either with a static value or a tag value. The tag value would be used if you want the range indications dynamic based on changing values. We will leave all of the values and colours as their default.
Select the options tab.
Option Tab
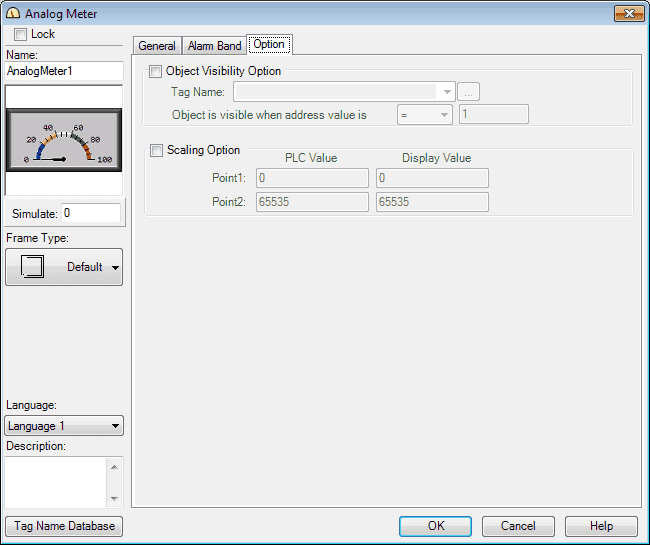
We can select the visibility if desired. In our case, we will not set this option.
Select the Scaling Option. We will set this so our value in the PLC will range from 0 to 4095 and will display 0 to 100.
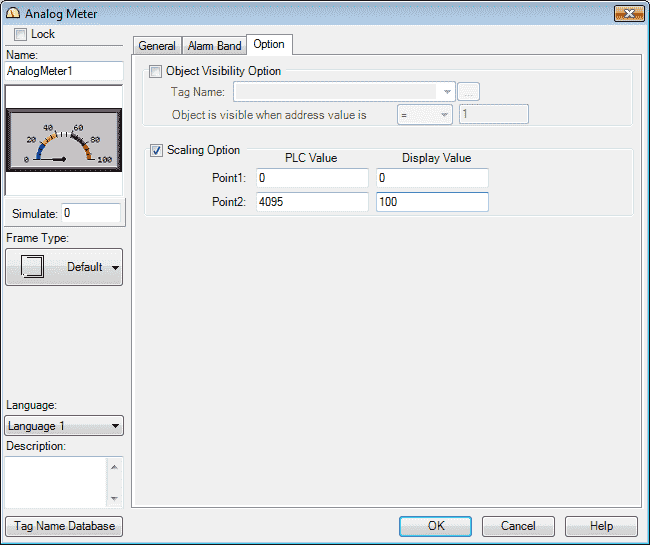
Select OK.

We can now use the mouse and size and move our analog meter object.
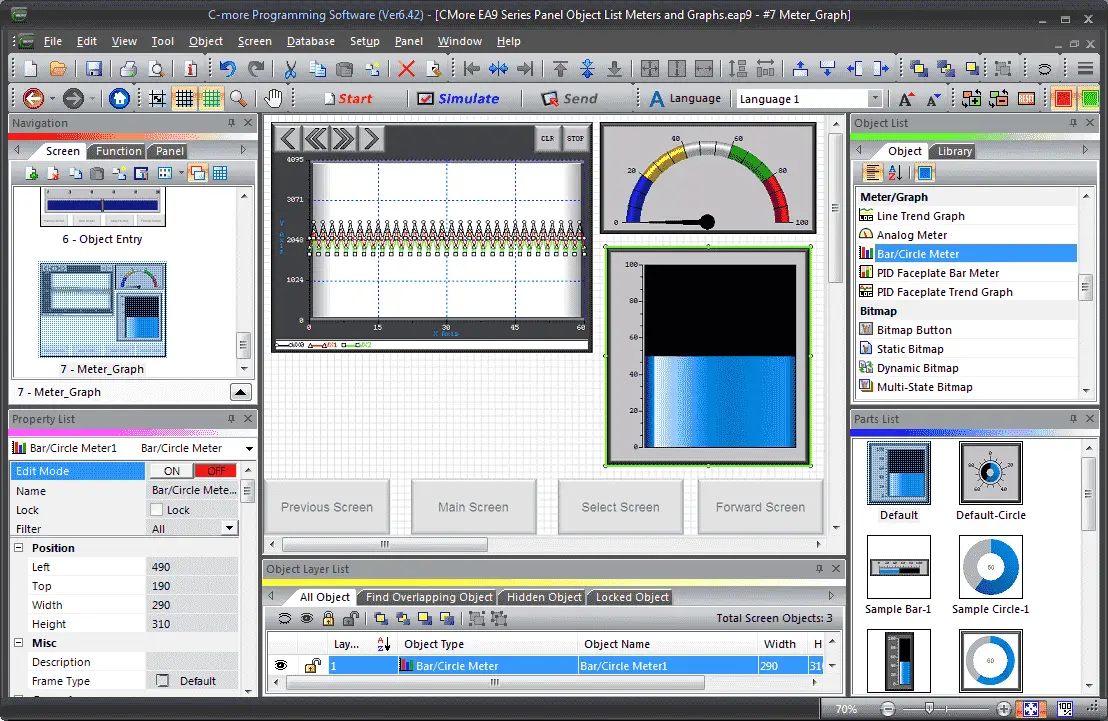
C-More Bar/Circle Meter
The Bar/Circle Meter Object is used to display variable data from a Tag Name in a Bar or Circle Meter format. The data can represent levels, currents, flows, speeds, and more. We will now add a bar meter object to our screen.

Select Bar/Circle Meter from the Object List under Meter/Graph. Now click and hold Default from the parts list and drag onto our screen.
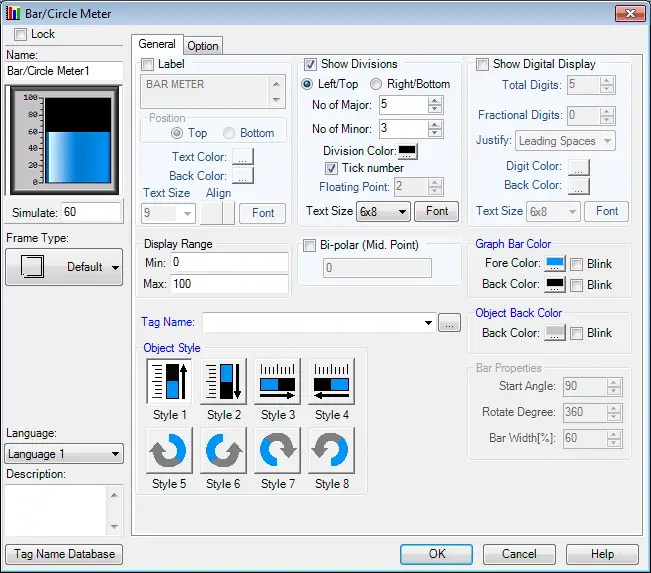
The bar/circle meter window will now appear. The bar circle meter object is very similar to the Analog Meter Object programmed above.
We will leave everything as the default except for our tag name.
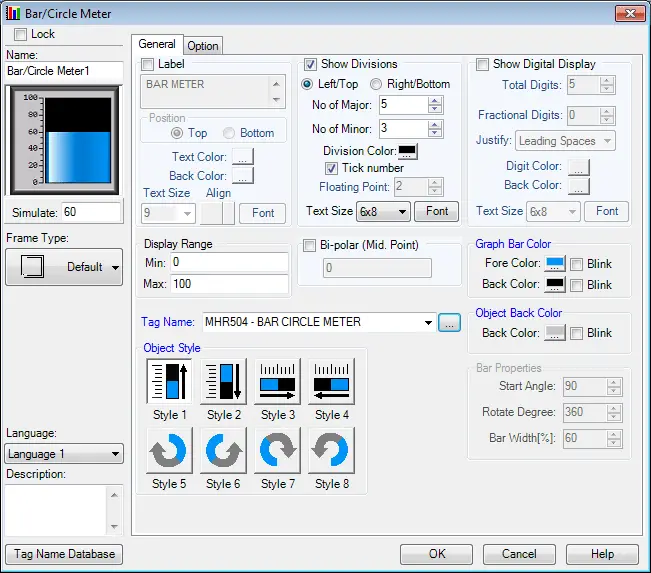
Our Tag Name will be set for MHR504 (Modbus Address 40504). Note: The display range is set between 0 and 100 on our bar meter.
Select the options tab.
Option Tab
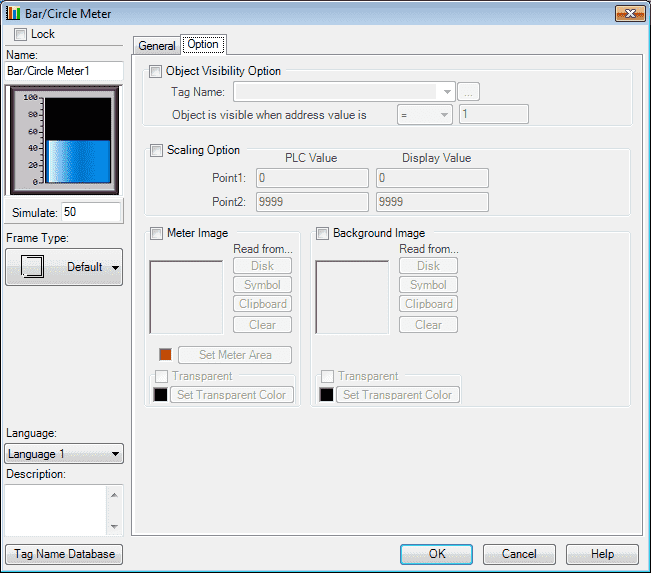
We will not use visibility.
Select the Scaling Option. We will set this so our value in the PLC will range from 0 to 4095 and will display 0 to 100.

We have options to also set the Meter Image and Background Image if required. We will not set these options.
Select OK
We can now use the mouse and size and move our bar circle meter object.
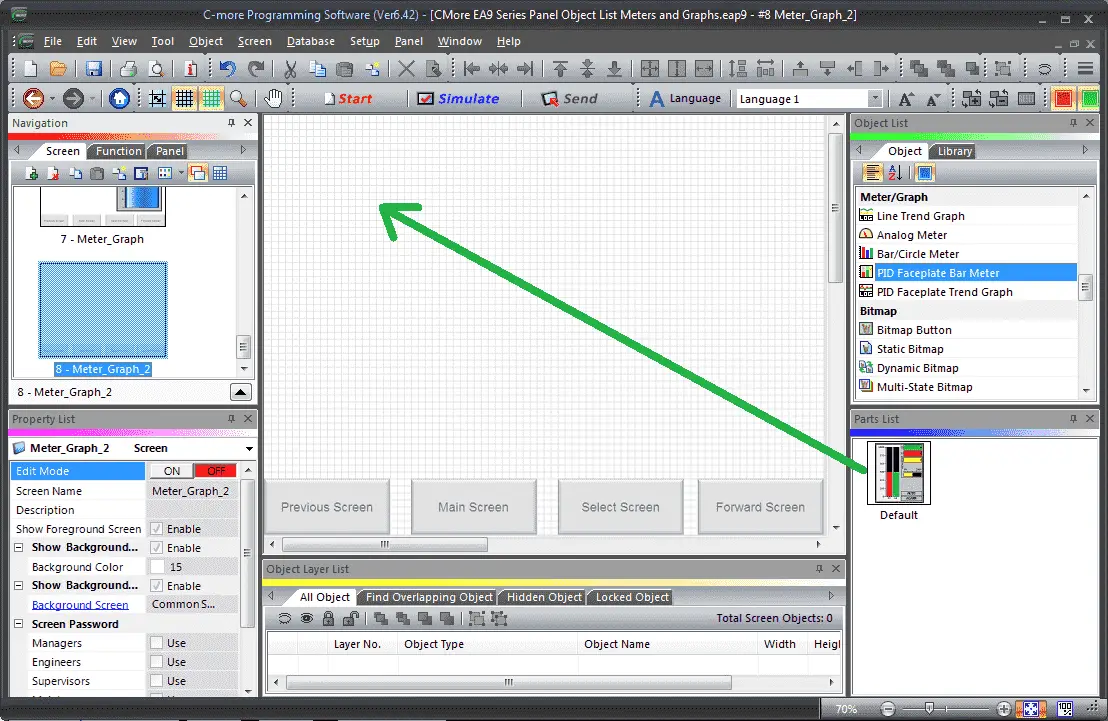
Setting Another Meter Graph Screen – C-More
We will now add another screen to the program. Select a new screen under the main menu | Screen | New Screen…
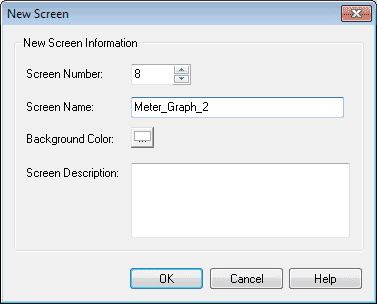
We will name screen 8 Meter_Graph_2. The screen description can be used to describe the screen. Hit OK.
Our new screen will now be displayed.
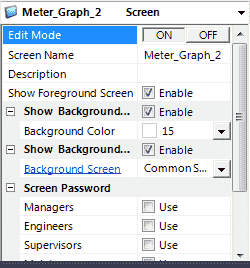
Under the property, list window turn on the editing and enable the show background. Select Common Screen Menu under the background screen. Turn off the edit mode under the property list.

We must now add our new screen so we can select it when using the common screen menu. Select page 100. Select the Screen Selector button. Under the Screen tab, select the 8 – Meter_Graph_2 and hit the Add button so it moves it over to the Current Screen Buttons. Hit OK. We can now go back to our newly created Object Indicators screen page 7 from our navigation window.
Our new screen is now ready for us to add additional meter and graphs.
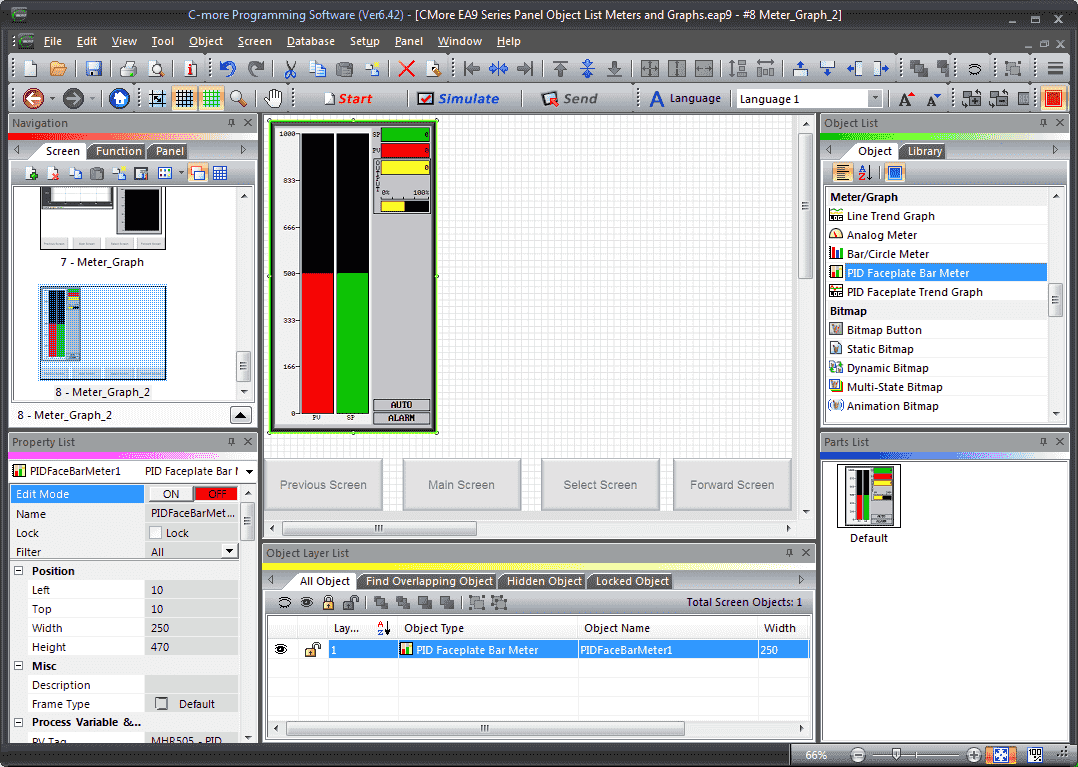
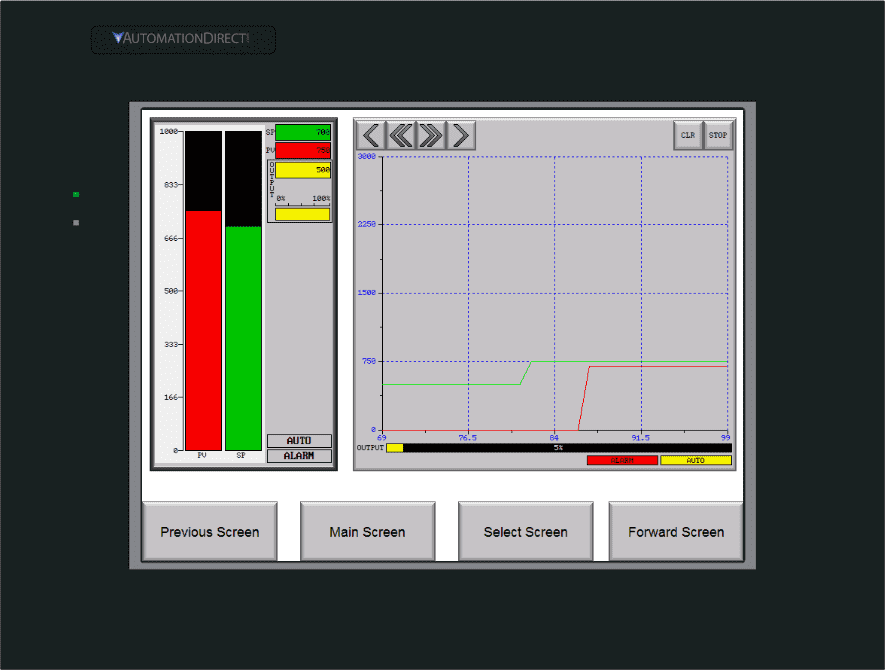
PID Faceplate Bar Graph
PID stands for Proportional Integral Derivative. PID is an algorithm used by PLC’s to control a process using a Control Loop. The PID Faceplate Bar Meter Object is used to monitor Control Loop assigned Tag Names continuously and display the readings using Bar Meters.
Select PID Faceplate Bar Meter from the Object List under Meter/Graph. Now click and hold Default from the parts list and drag onto our screen.
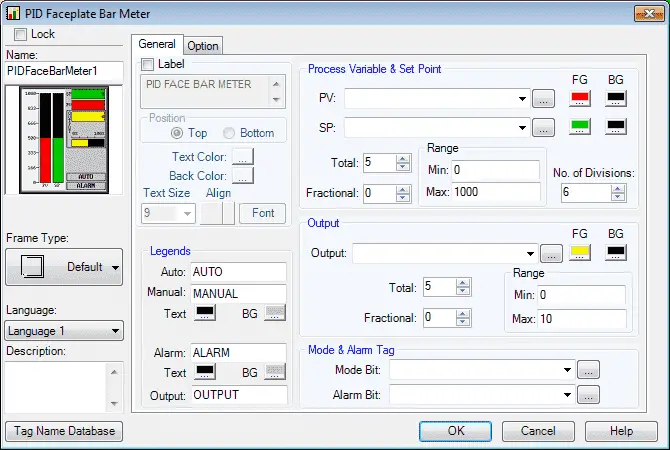
The PID Faceplate Bar Meter window will now appear.
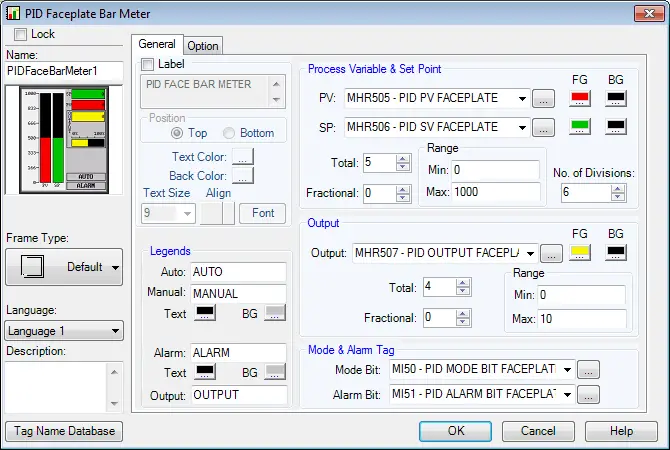
We will leave most of the settings on default. Our tag names will be set as follows.
PV: MHR505 (Modbus Address 040505) – Present Value
SV: MHR506 (Modbus Address 040506) – Set Value
Output: MHR507 (Modbus Address 040507) – Output Value
Mode Bit: MI50 (Modbus Address 010050) – Mode Bit (Automatic / Manual)
Alarm Bit: MI51 (Modbus Address 010051) – Alarm Bit
Select the option tab.
Option Tab
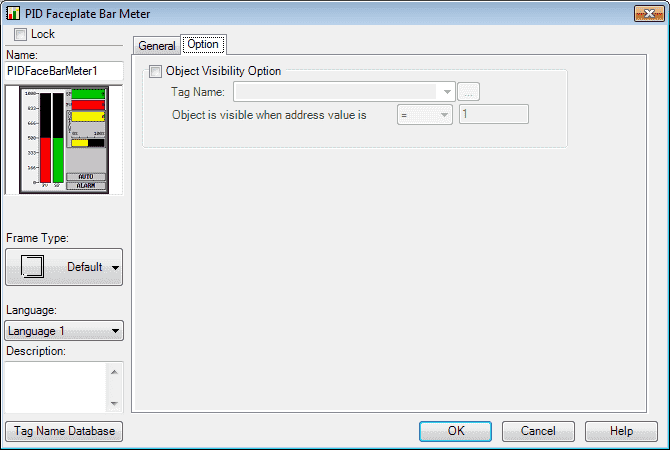
We will not use visibility.
Select OK.
We can now use the mouse and size and move our PID faceplate bar meter object.
PID Faceplate Trend Graph
The PID Faceplate Trend Graph Object is used to monitor Control Loop assigned Tag Names continuously. This Object is much like a digital version of a chart recorder used for industrial processes.
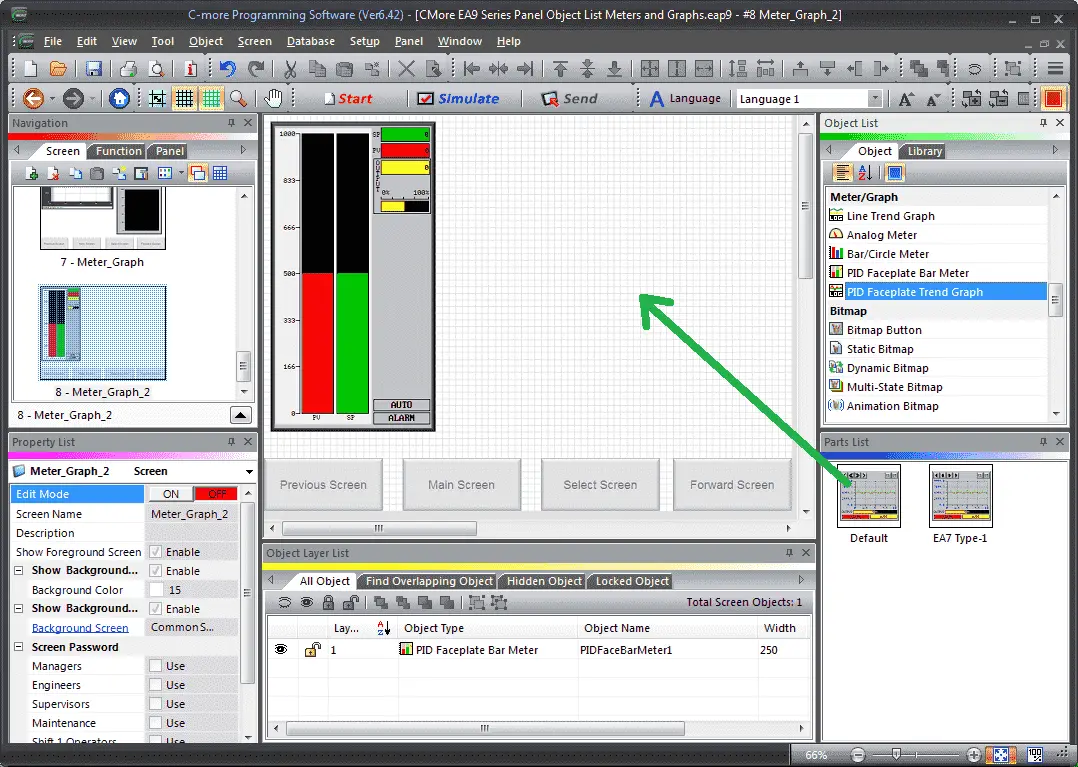
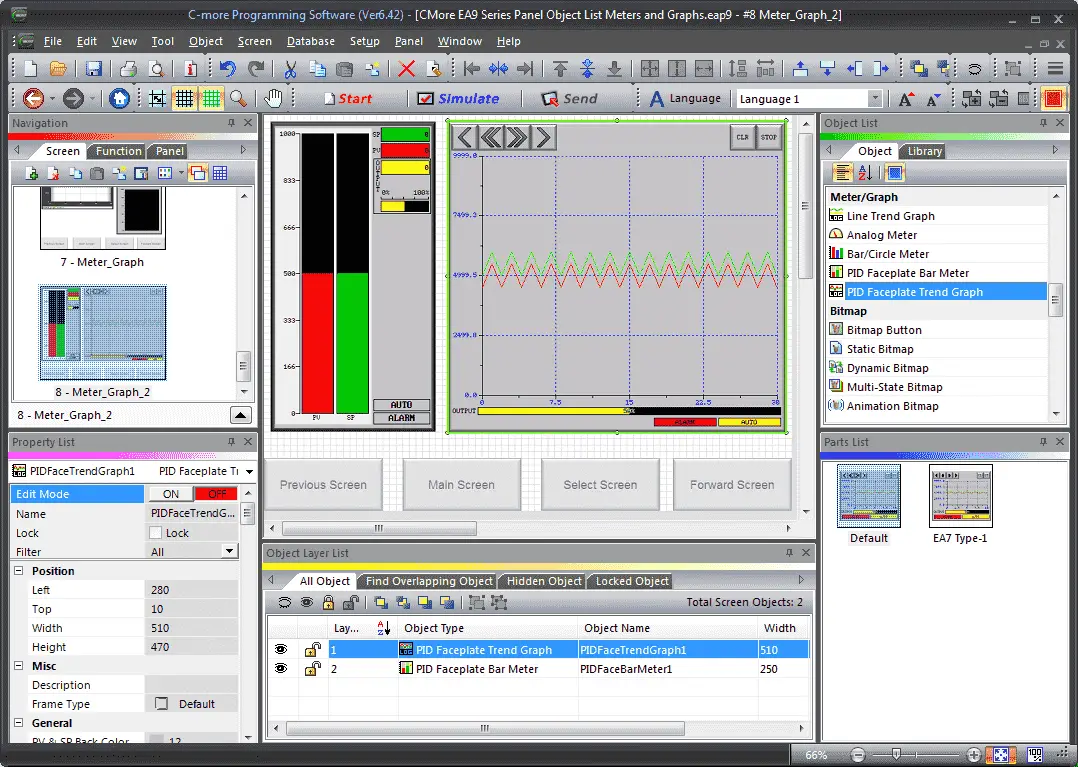
Select PID Faceplate Trend Meter from the Object List under Meter/Graph. Now click and hold Default from the parts list and drag onto our screen.
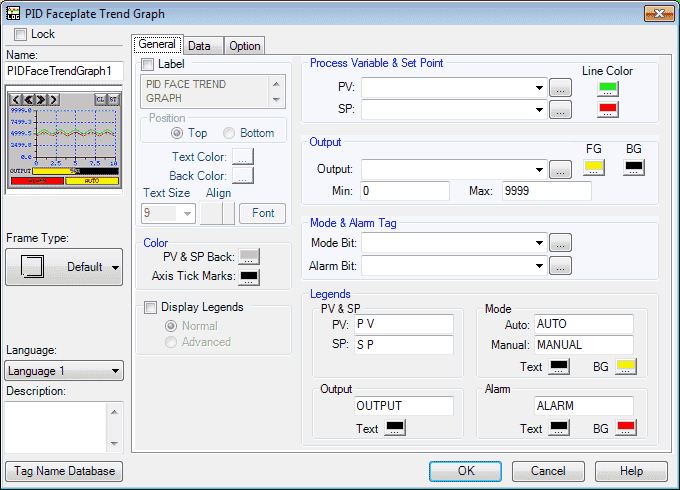
The PID Faceplate Trend Meter window will now appear.
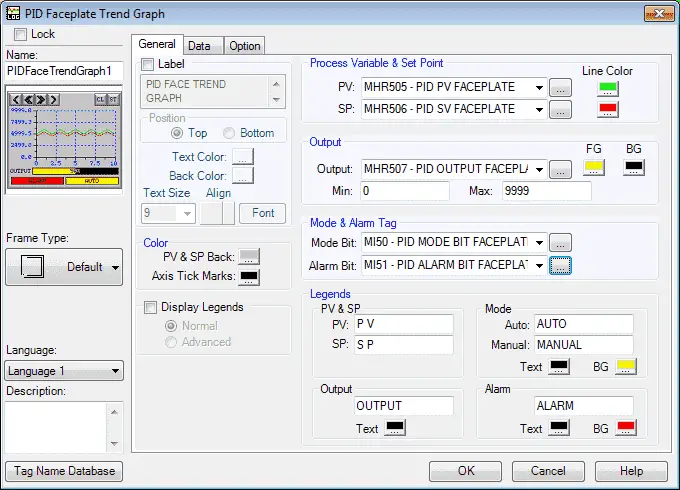
We will leave most of the settings on default. Our tag names will be set as follows.
PV: MHR505 (Modbus Address 040505) – Present Value
SV: MHR506 (Modbus Address 040506) – Set Value
Output: MHR507 (Modbus Address 040507) – Output Value
Mode Bit: MI50 (Modbus Address 010050) – Mode Bit (Automatic / Manual)
Alarm Bit: MI51 (Modbus Address 010051) – Alarm Bit
Select the Data tab.
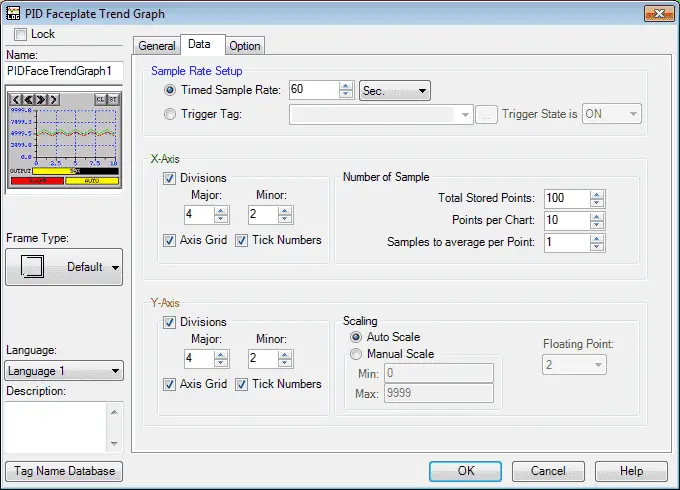
We will set the timed sample rate to 1 second. Our points per chart will be set for 30. This means that our graph will hold half a minutes worth of data. Everything else will be left as their default values.
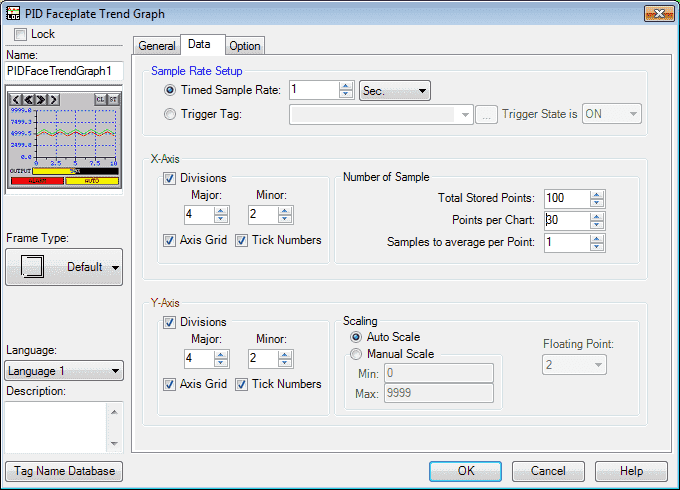
Note: These settings are similar to our line trend graph above.
Select the options tab.
Option Tab
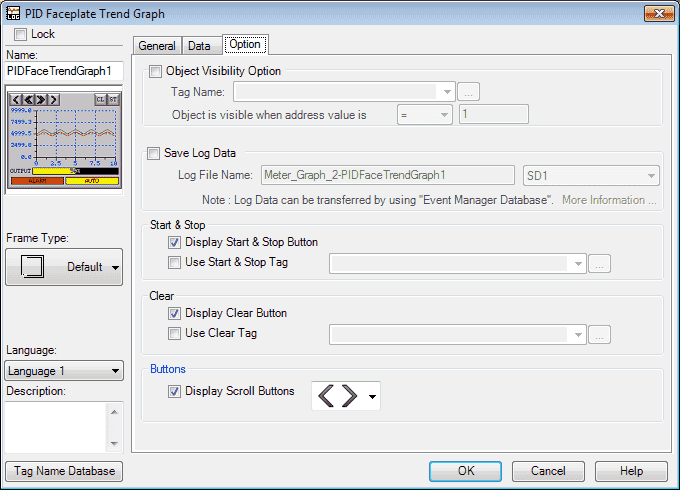
We will not use visibility.
Save Log Data: We can use this selection to save our data to a file. This can be saved to internal or external memory like a USB.
Start & Stop: We can choose whether to display or not the Start and Stop buttons on the graph. A tag in the PLC can also be used to start and stop the graph.
Clear: We can choose to display a clear button on the graph which can also be a tag in the PLC.
Buttons:
We will use the Display Scroll Buttons. You will see that there are a couple of different options for the symbols on the graph.
Select OK.
We can now use the mouse and size and move our PID faceplate bar meter object.
Simulate our C-More Meters and Graphs
We can use the simulator to view and try our meter and graph objects. This will ensure the visual and address operations that we want in our program.
PLC Program Additions – C-More Graphs Meters
Using the program we previously developed, we will add additional rungs to control the meter graph objects that we have just created.
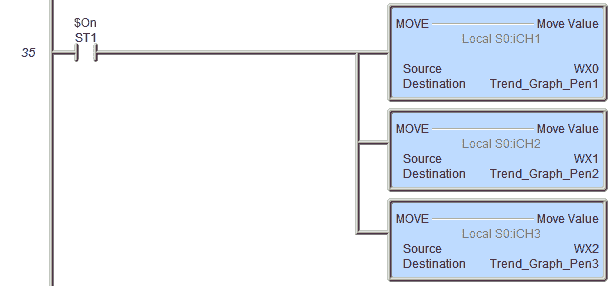
Set our three pens for our line trend graph.
Move WX0 to address MHR500 (Modbus 40500). WY0 has a range from 0 to 4095.
Move WX1 to address MHR501 (Modbus 40501). WY1 has a range from 0 to 4095.
Move WX2 to address MHR502 (Modbus 40502). WY2 has a range from 0 to 4095.
Note: Our scaling is done in the EA9 HMI.
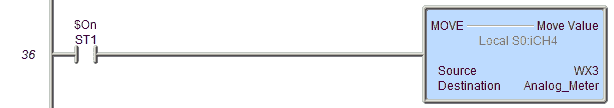
Set our Analog Meter value.
Move WX3 to address MHR503 (Modbus 40503). WY3 has a range from 0 to 4095.
Note: Our scaling is done in the EA9 HMI.
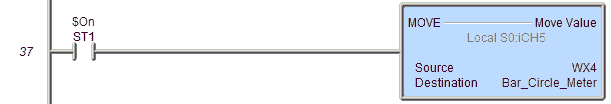
Set our Bar Circle Meter value.
Move WX4 to address MHR504 (Modbus 40504). WY4 has a range from 0 to 4095.
Note: Our scaling is done in the EA9 HMI.
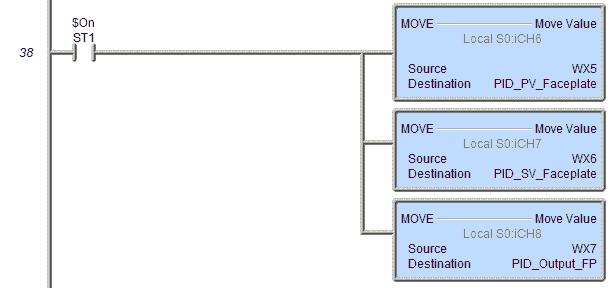
Set our PID values. Note: The PLC will need to be programmed for a PID loop before this will function correctly. The HMI is just a display for the values.
Move WX5 to address MHR505 (Modbus 40505) – PV Faceplate Value
Move WX6 to address MHR505 (Modbus 40506) – SV Faceplate Value
Move WX7 to address MHR505 (Modbus 40507) – Output Faceplate Value
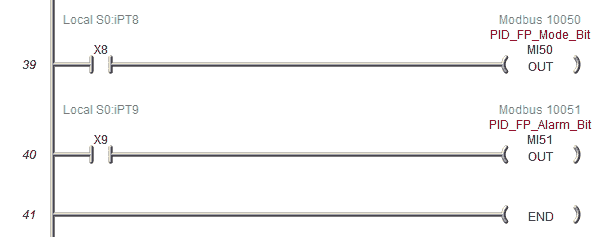
X8 will turn on the Mode Bit of the PID. (Automatic / Manual)
X9 will turn on the Alarm Bit of the PID.
Download the PLC and C-More program here.
Watch the video below to see the Meter Graph Objects in action on our C-More EA9 HMI Panel. This will also demonstrate the PLC ladder code for functionality.
C-More EA9 Panels from Automation Direct
https://www.automationdirect.com/c-more/home
C-More – Graphic Panel (EA9 Series) User Manual and Quick Start Guides
https://cdn.automationdirect.com/static/manuals/ea9userm/ea9userm.html
EA9-T10CL C-More Specifications
https://cdn.automationdirect.com/static/specs/ea9t10cl.pdf
C-More EA9 Programming Software (Current Version V6.42)
https://support.automationdirect.com/products/cmore.html
This software will enable you to program all of the C-More EA9 HMI units. It includes a simulator for your application.
Next time we will look more at the object list Bitmaps that we can use in the C-More HMI Panel.
Watch on YouTube: C-More EA9 HMI Series Panel Object List Meters and Graphs
If you have any questions or need further information please contact me.
Thank you,
Garry
If you’re like most of my readers, you’re committed to learning about technology. Numbering systems used in PLC’s are not difficult to learn and understand. We will walk through the numbering systems used in PLCs. This includes Bits, Decimal, Hexadecimal, ASCII and Floating Point.
To get this free article, subscribe to my free email newsletter.
Use the information to inform other people how numbering systems work. Sign up now.
The ‘Robust Data Logging for Free’ eBook is also available as a free download. The link is included when you subscribe to ACC Automation.