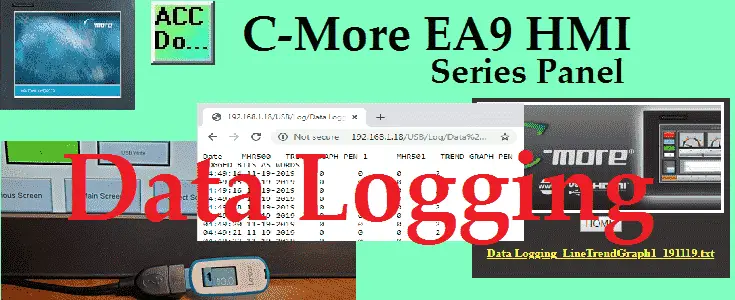
The C-More HMI Panel can log data using the Line Trend Graph or PID Faceplate Trend Graph objects. When Save Log Data is selected on the Options tab configuration for that object, data is written to a “.txt ” file saved to the storage device selected.
Data Logging is commonly used to monitor systems and/or processes taking place at an industrial facility, providing time, date, and current conditions as configured on the Object. Data Logging can be used to collect temperatures, flows, alarms, levels, pressure and just about any instrument measurable condition.
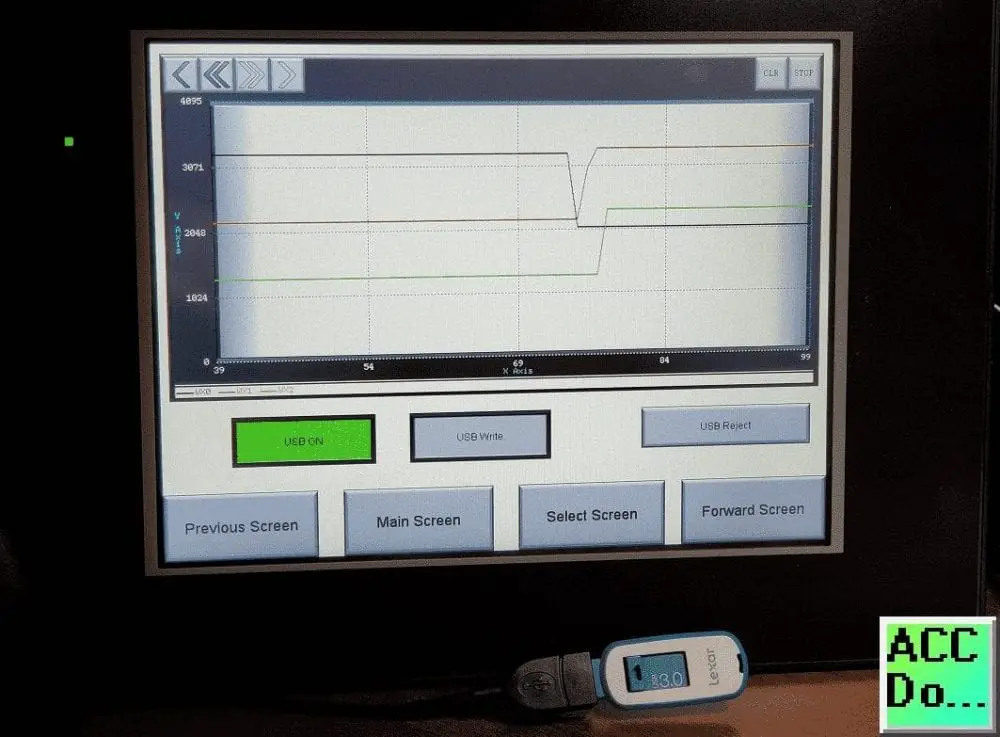
We will be data logging from a Line Trend Graph. A register (word) made up of bits will also be logged. We will log this information every second on our USB stick. Starting/stopping the logging can be controlled on the HMI as well as USB reject. Once the USB is ejected, it can then be connected to our computer to review the files. We will also view and download the files from our web server that we enabled last time on our C-More EA9 HMI panel. Let’s get started.
Previously in this C-More EA9 HMI Panel series, we have done the following:
System Hardware
– Unboxing and Review Video
– Powering the Unit Video
Installing the Software – Video
System Setup Screens – Video
First Program
– Establishing Communication and Updating Firmware Video
– First Program Video
Panel to PLC and PLC to Panel Settings – Video
Common Screen Menu – Video
Simulate Project – Video
Object List Shapes – Video
Object List Buttons – Video
Object List Indicators – Video
Object List Entry – Video
Object List Meters and Graphs – Video
Object List Bitmaps – Video
Object List Recipe – Video
Define Custom Keypad – Video
Object List Alarms – Video
Object List Text – Video
Object List Clock – Video
Barcode Scanner Input – Video
Web Server and Remote Access – Video
Watch the video below to see the data logging to USB in action on our C-More EA9 HMI Panel.
Setting Our C-More Data Logging Screen
We will be adding to the program we created last time. (Web Server and Remote Access)
Select a new screen under the main menu | Screen | New Screen…
Alternatively, we can also use the icons in the Navigation panel.
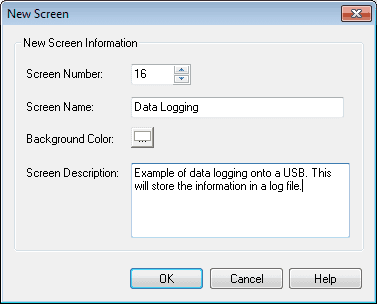
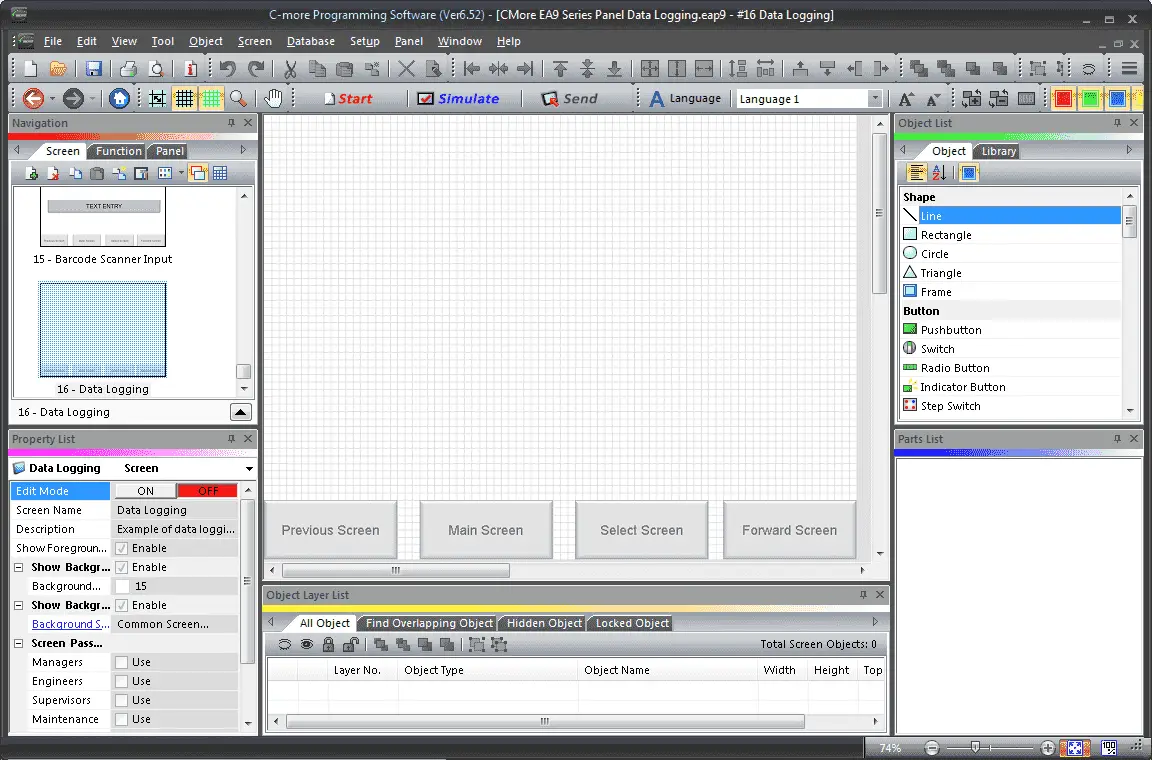
We will name screen 16 Data Logging. The screen description can be used to describe the screen. Hit OK.
Our new screen will now be displayed.

Under the property list window, turn on the editing and enable the show background. Select Common Screen Menu under the background screen. Turn off the edit mode under the property list.
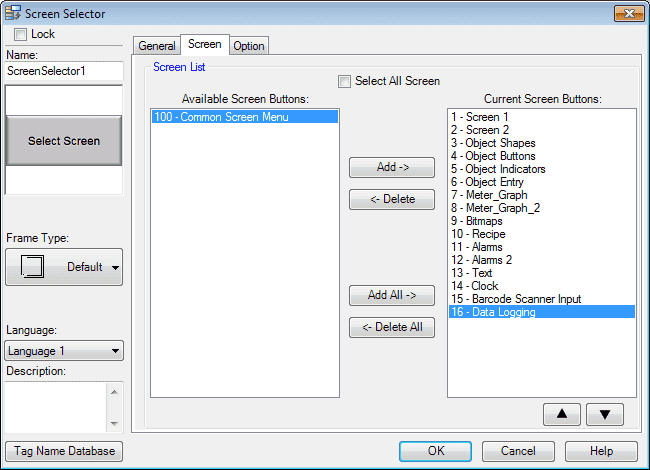
We must now add our new screen so we can select it when using the common screen menu. Select page 100. Select the Screen Selector button. Under the Screen tab, select page 16 – Data Logging and hit the Add button so it moves it over to the Current Screen Buttons. Hit OK. We can now go back to our newly created Data Logging screen page 16 from our navigation window.
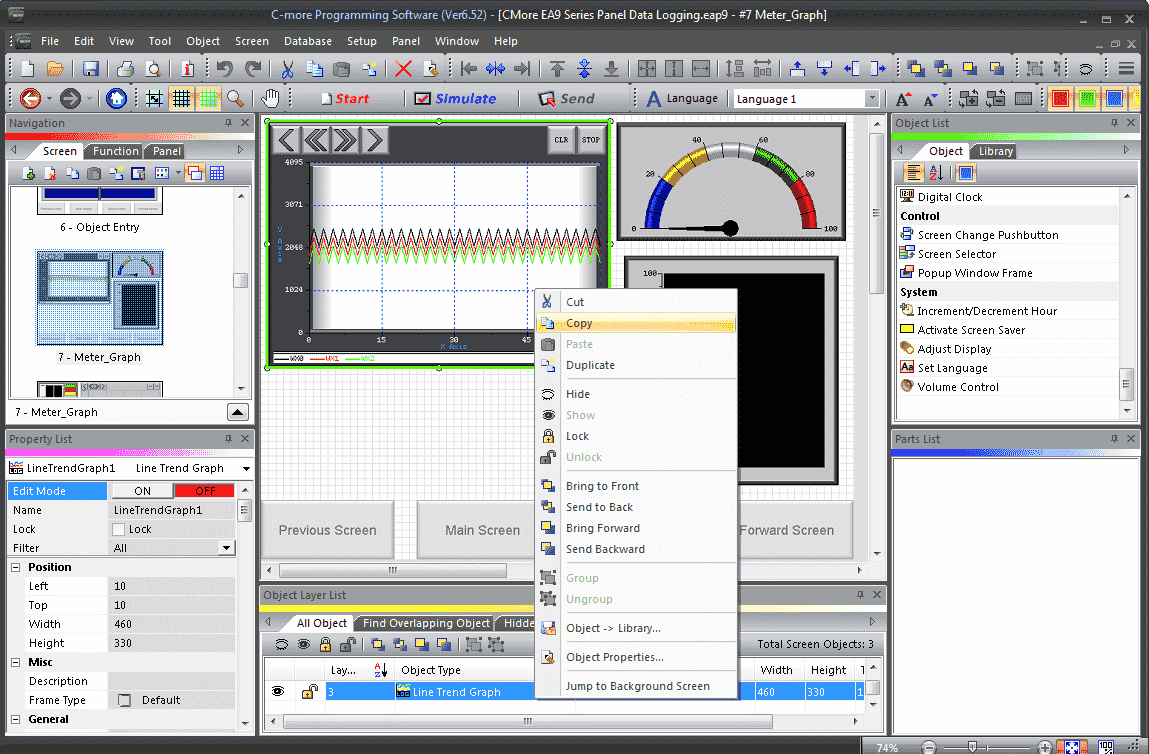
Go to screen 7 – Meter_Graph and right-click on the Line Trend Graph. Select Copy.
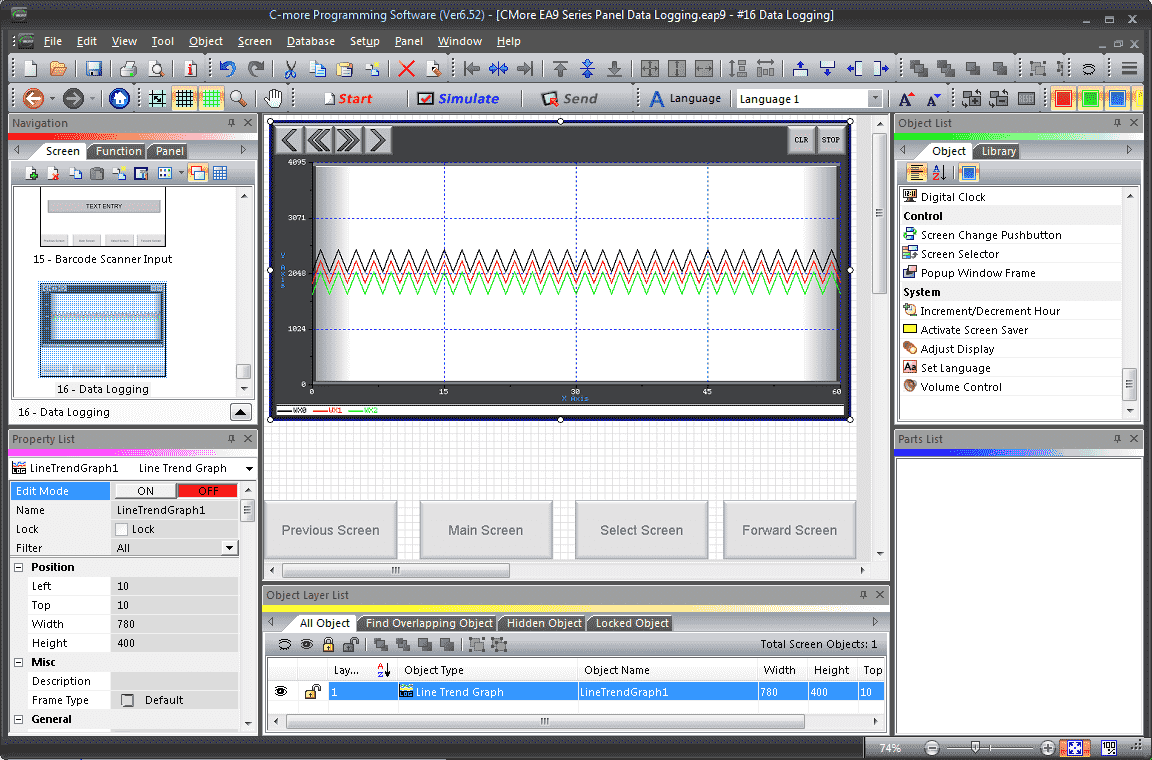
Go to screen 16 – Data Logging and right-click on the work area and select paste. We can then resize the line trend graph to fit the screen.
Double click on the line trend graph to call up the Line Trend Graph window.
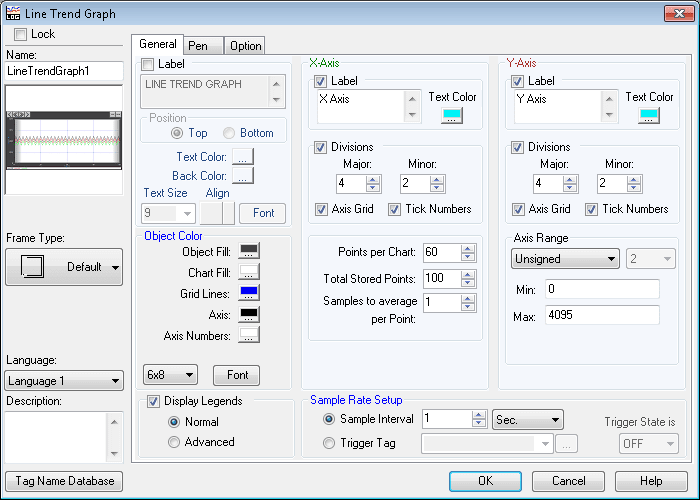
You can see all of the settings that we previously set for the graph. Note that the sample rate is set for an interval of 1 second. Select the Pen tab.
In general, attempts to log data at intervals faster than once per second will be unreliable due to the write time required.
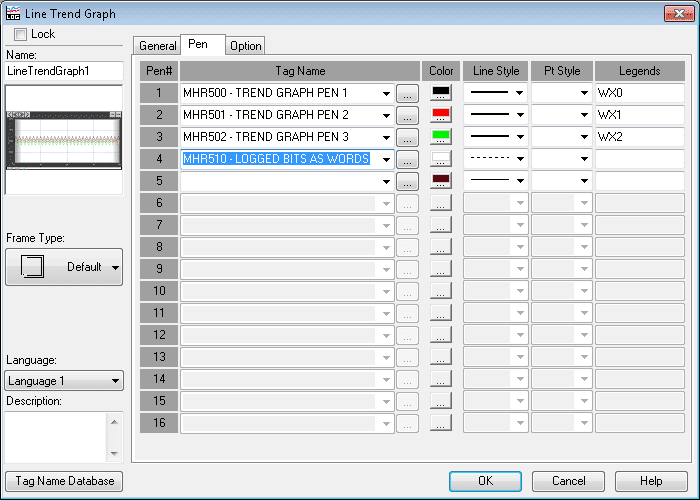
We will now add an additional pen to our graph. This will be memory location MHR510 – Logged Bits as Word. The colour will be white so it will not appear on our graph. Click the Options tab.
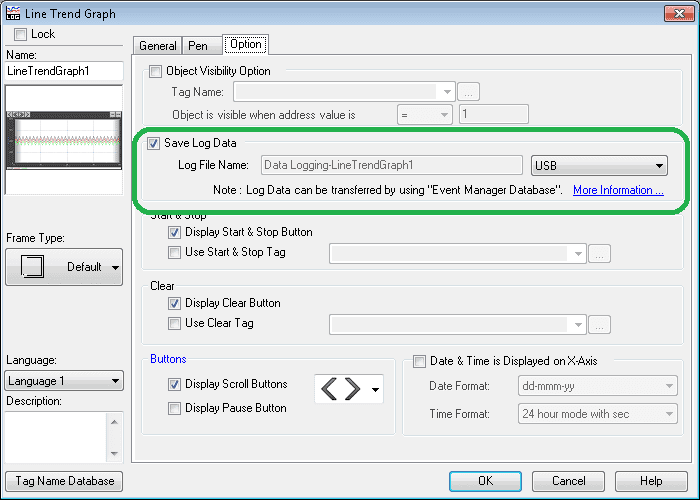
Select the save log data box. The log file name will be ‘Data Logging’ Line Trend Graph 1. Set the device to be USB. Select OK
Our line trend graph is now set to log to our USB device.
USB Operation – C-More Data Logging
We will now add some indication and control to our USB device. This will allow us to see if the USB is present, writing, and have the ability to eject the device.
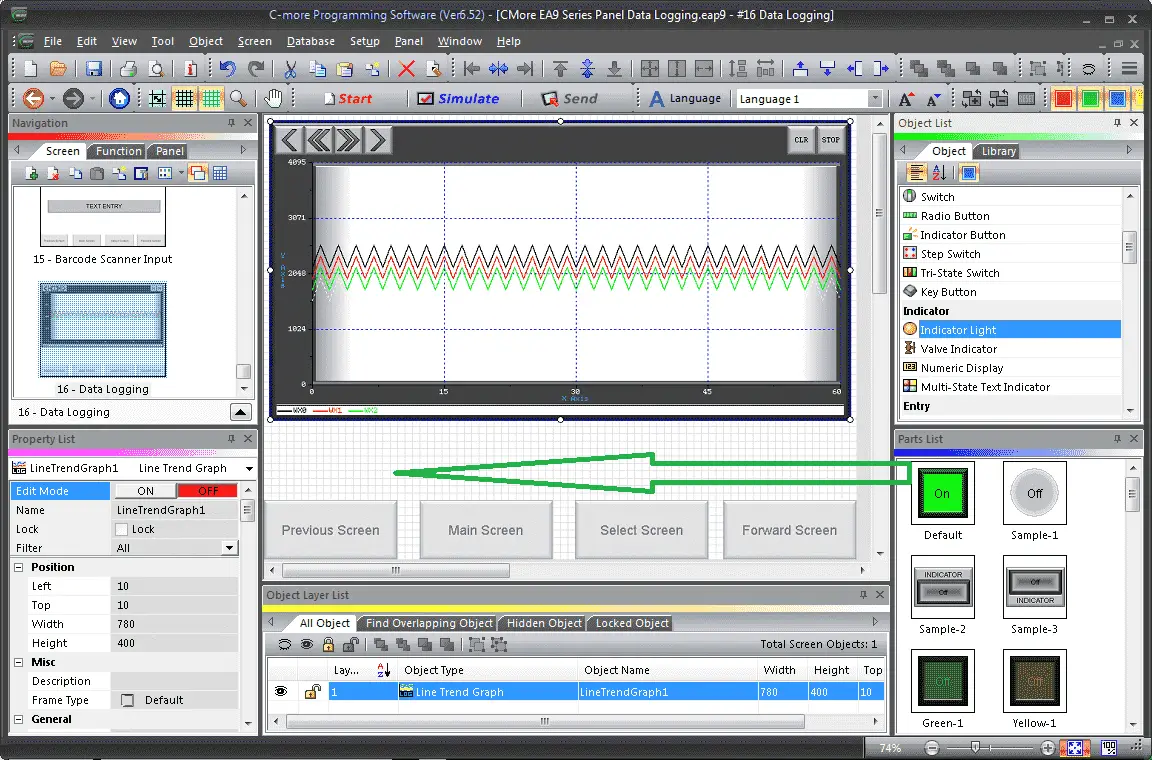
We will now add an Indicator Light under the Indicator heading in the Object list window. Left-click (hold) and drag the default from the parts list onto the screen.
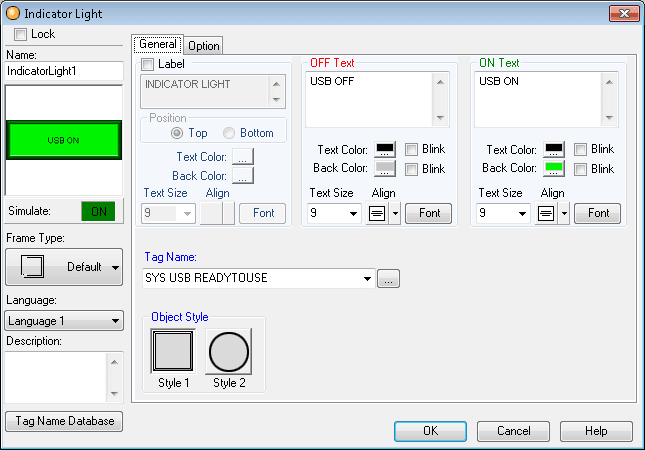
The off text will be set for USB OFF. The ON text will be set for USB ON. Our tag name for the indicator light will be the system bit SYS USB READYTOUSE. Select OK.
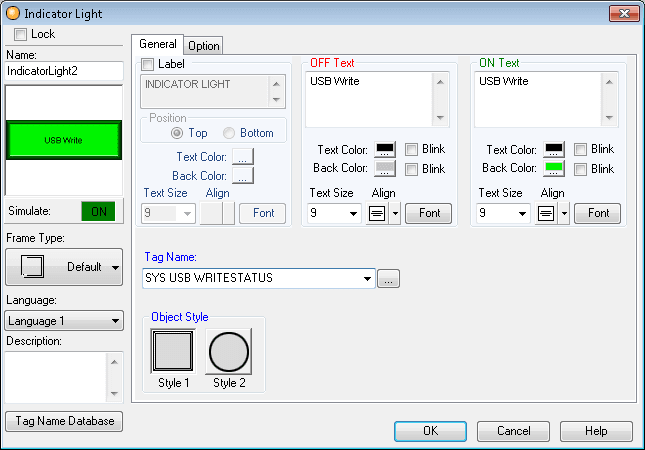
We will also add a USB write indication light. The OFF and ON text will be set as USB WRITE. The tag name will be set for the system bit SYS USB WRITESTATUS. Select OK.
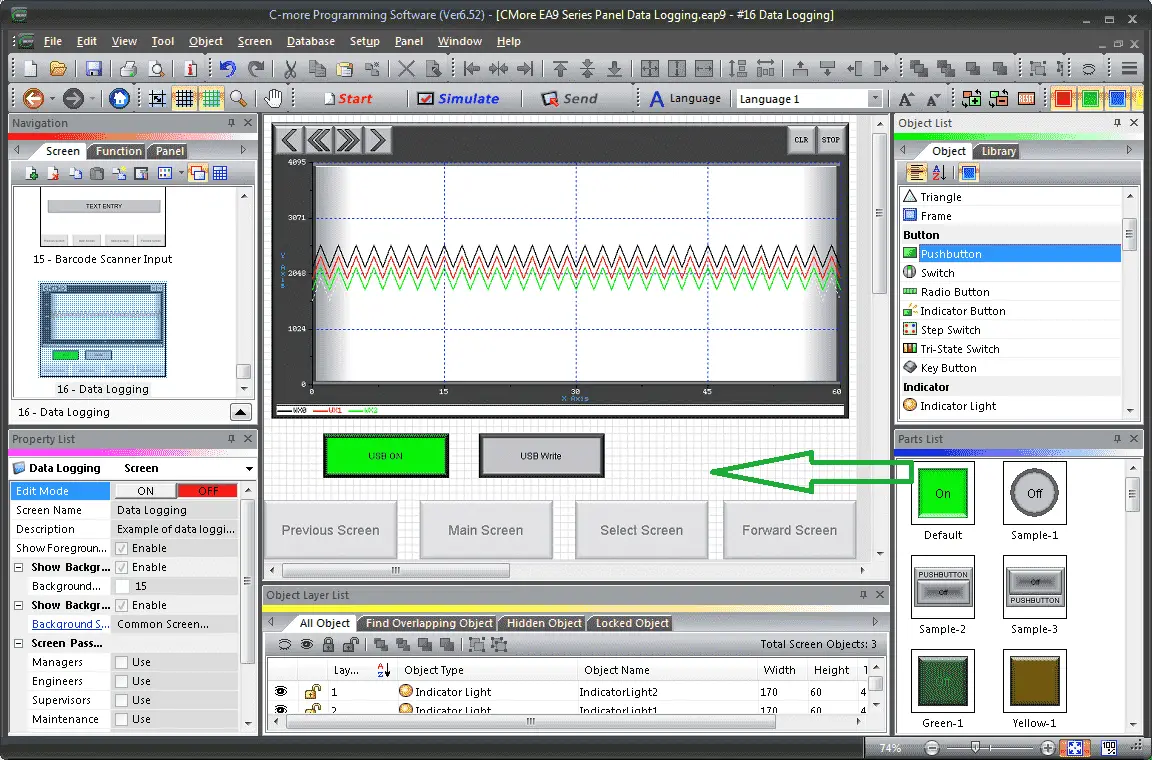
We will now add a Pushbutton under the Button heading in the Object list window. Left-click (hold) and drag the default from the parts list onto the screen.
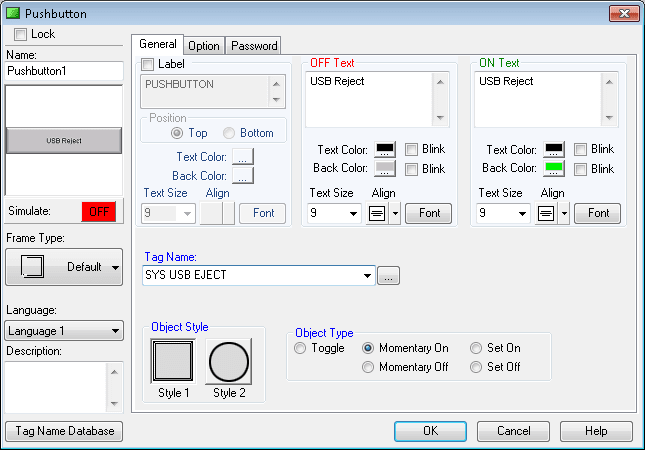
The OFF and ON text will be set for USB REJECT. The tag name will be the system bit SYS USB REJECT. The object type will be set for momentary on. Select OK.
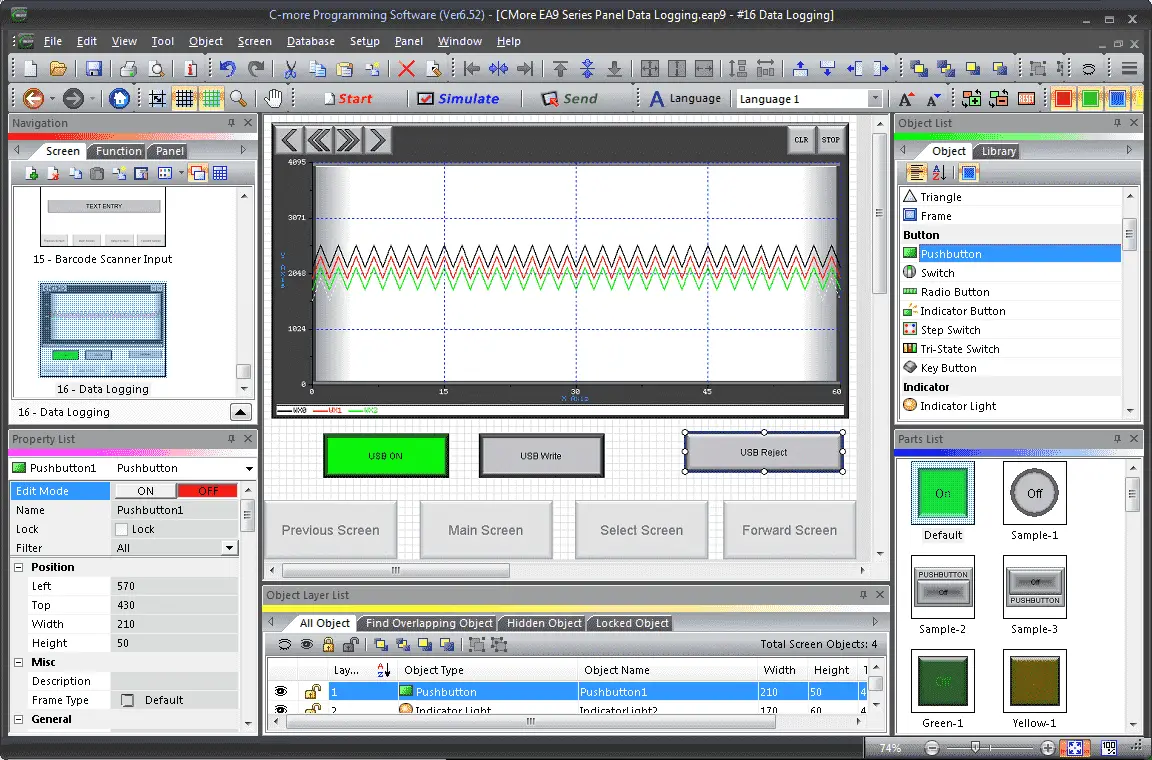
Our screen is now set to start logging data.
Panel Manager – C-More Data Logging
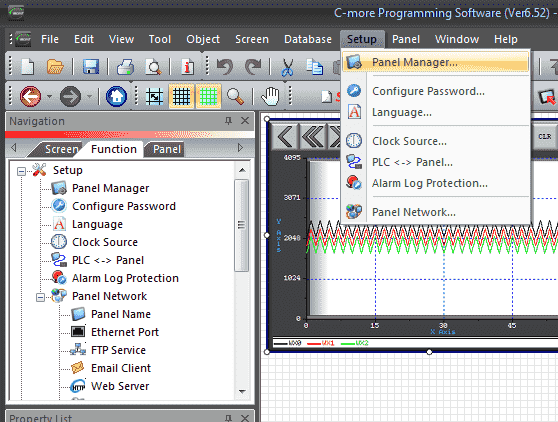
Select panel manager from the main menu | Setup | Panel Manager… You can also call up the panel manager by selecting it under Setup in the Function tab of the Navigation window.
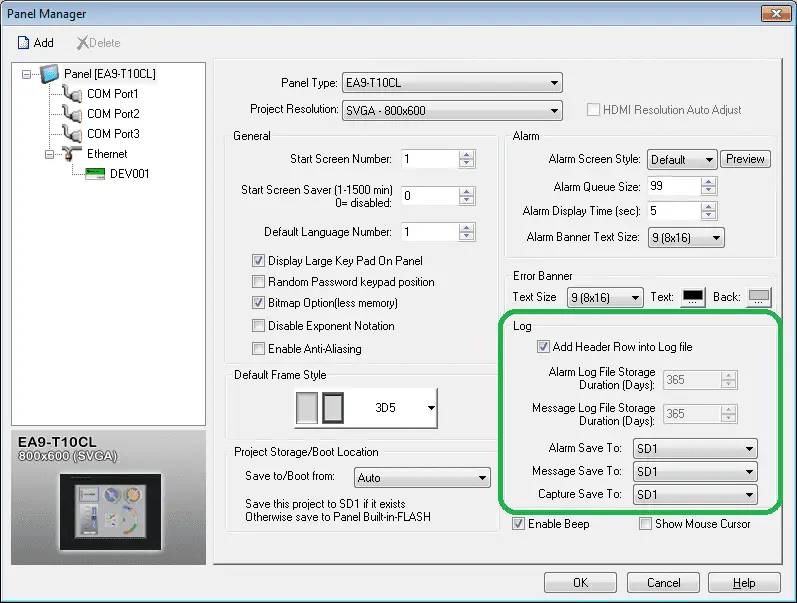
We can select ‘add header row into log file’ in the panel manager. This is the default value.
A maximum of 16 log files per panel can be used with the Trend Graph / PID Trend Log Data. You will also see that we can save our Alarm List Log and Message Database Log to memory devices. The capture will be used for screen captures.
PLC Program Additions for C-More Data Logging
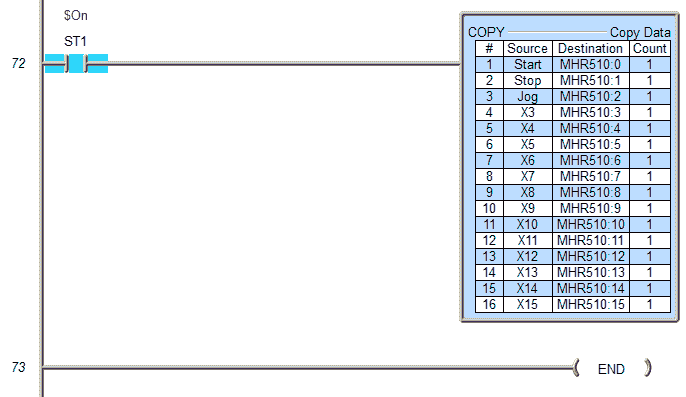
Using the program we previously developed, we will add an additional rung to copy the bits to the address MHR510.
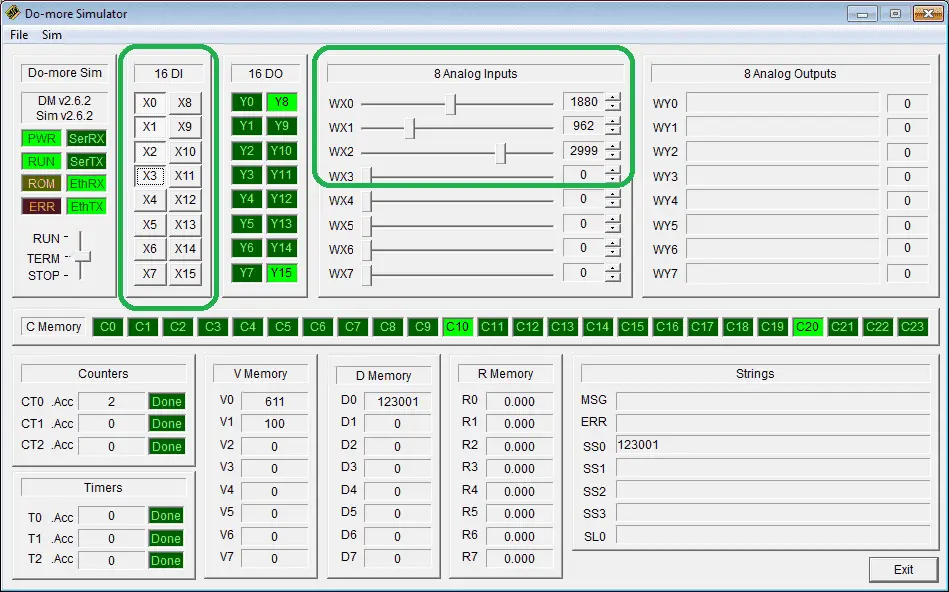
WX0, WX1, and WX2 are the inputs that will be placed on the Line Trend Graph.
These are placed in MHR500, MHR501, and MHR502. MHR510 is also read and placed on the graph. This is a combination of bits in the PLC. X0 to X15 – MHR510.
This way we can log the individual bits.
Watch the video below to see this in action on our C-More HMI.
Download the programs and run the software.
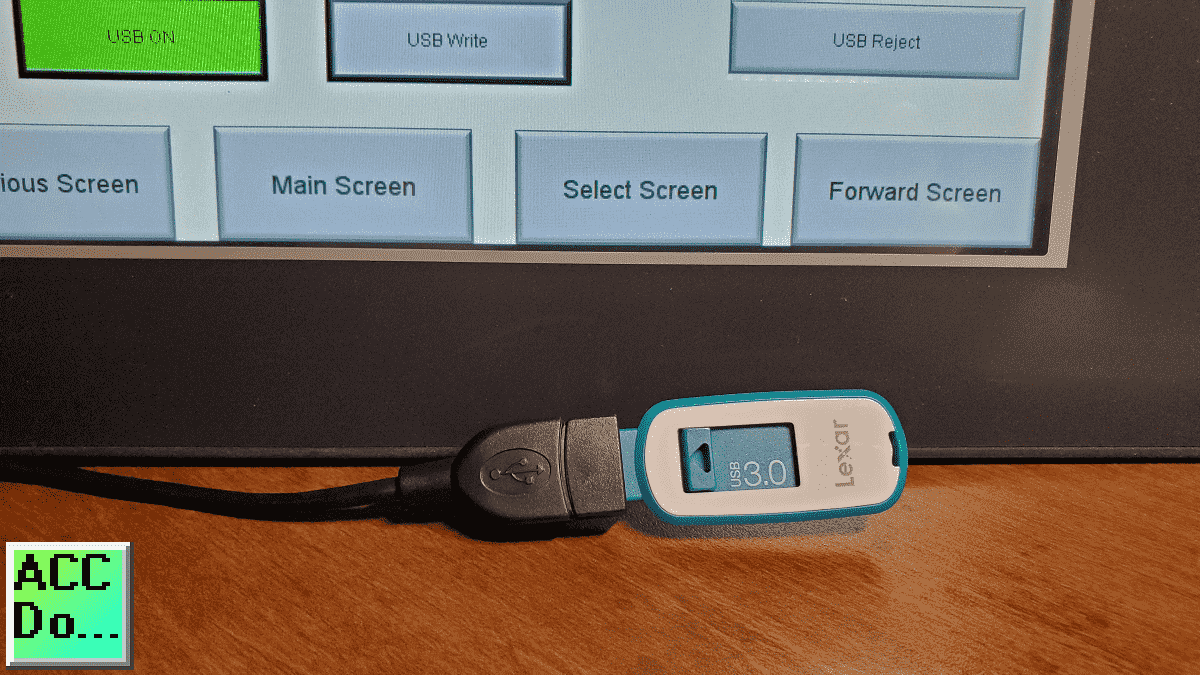
Our information will now be logged onto our USB.
Monitor the Data Logging File – C-More EA9
Call our Google chrome browser and enter the IP address of our HMI to see the webserver. Enter our credentials from last time. Username: ACC Automation Password: acca
Select Sign in.
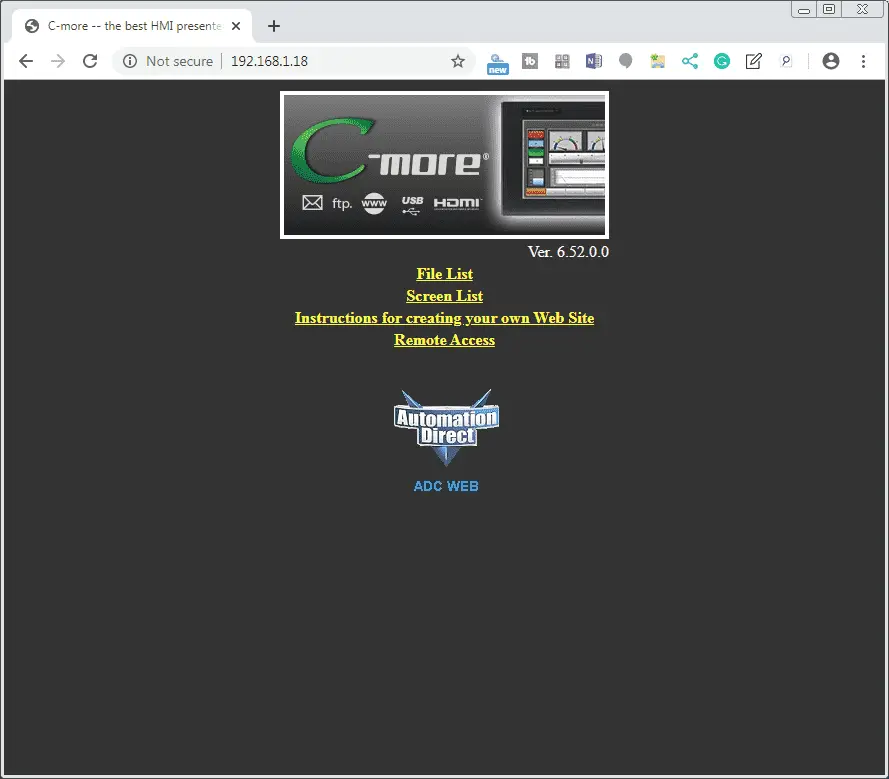
The default web page will now be shown. Select the File List from the menu.
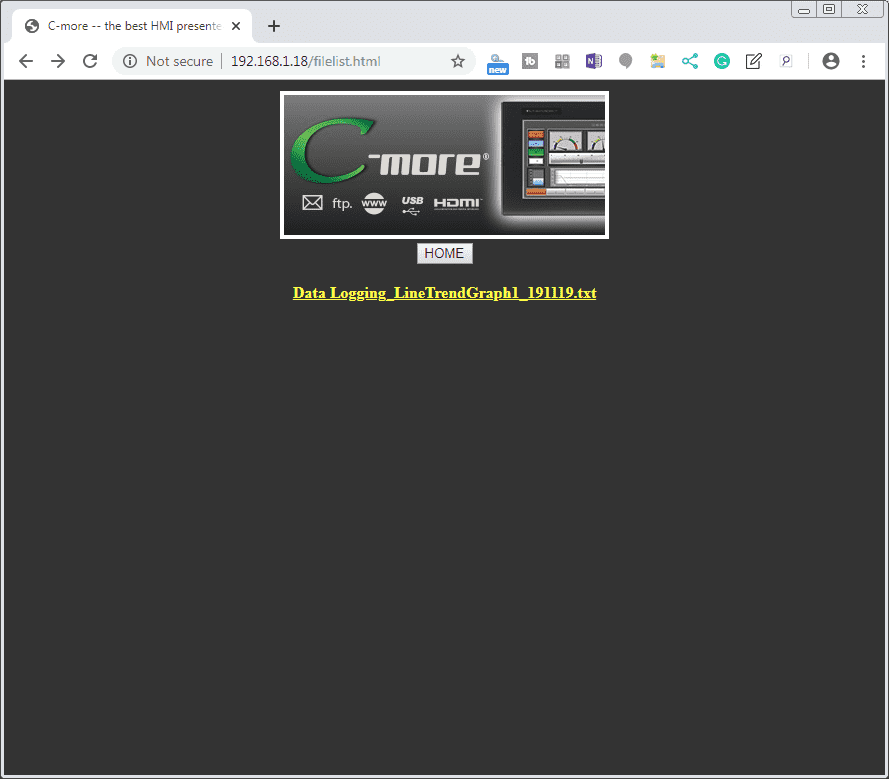
The logged files will now be displayed. Click on the logged file.
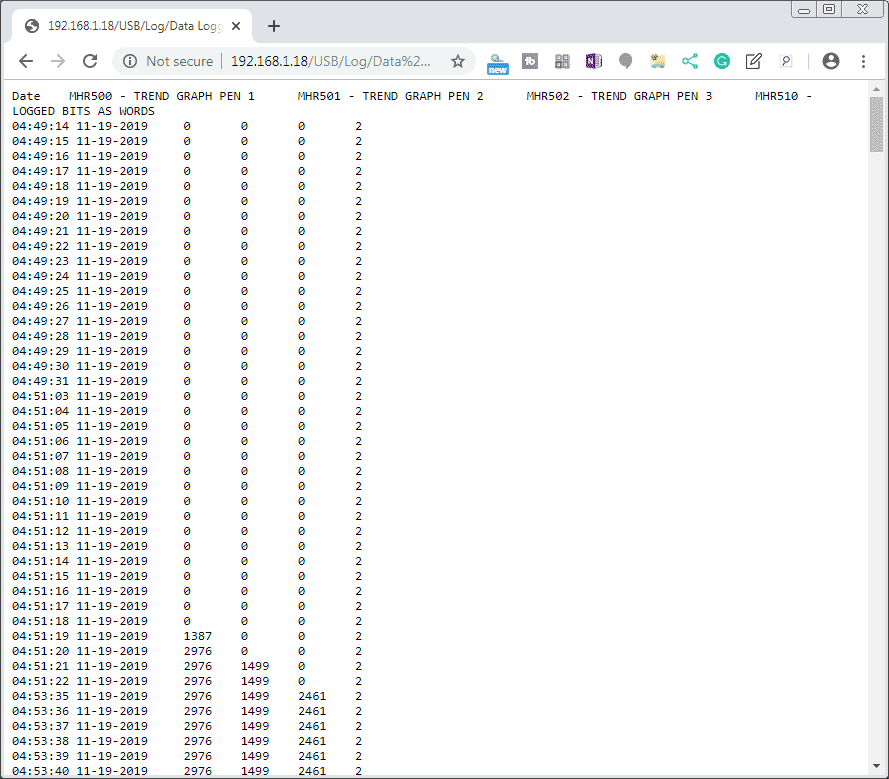
Our data will now be shown in our web browser. We can copy this logged information directly from our web browser and past it into an excel sheet in text format. (This will keep the columns separated.)
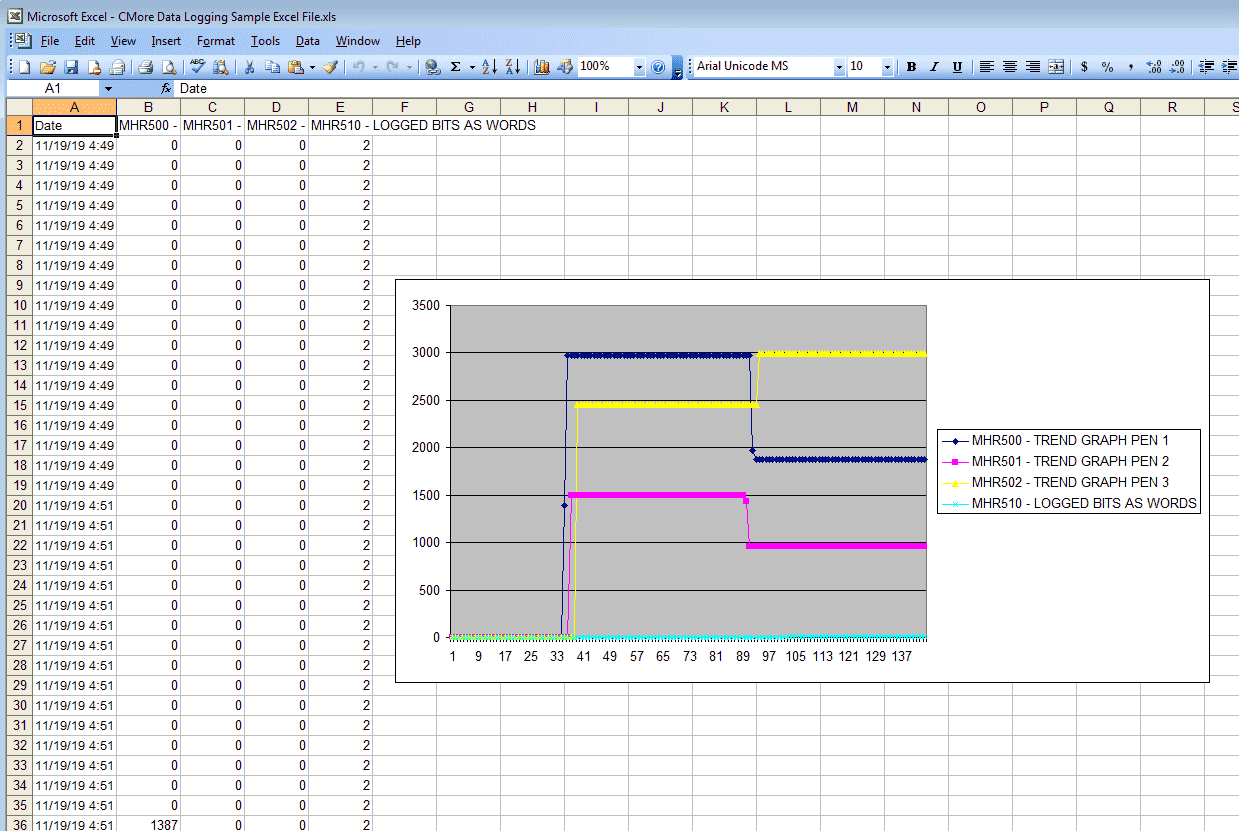
In excel we can then manipulate the data the way we want.
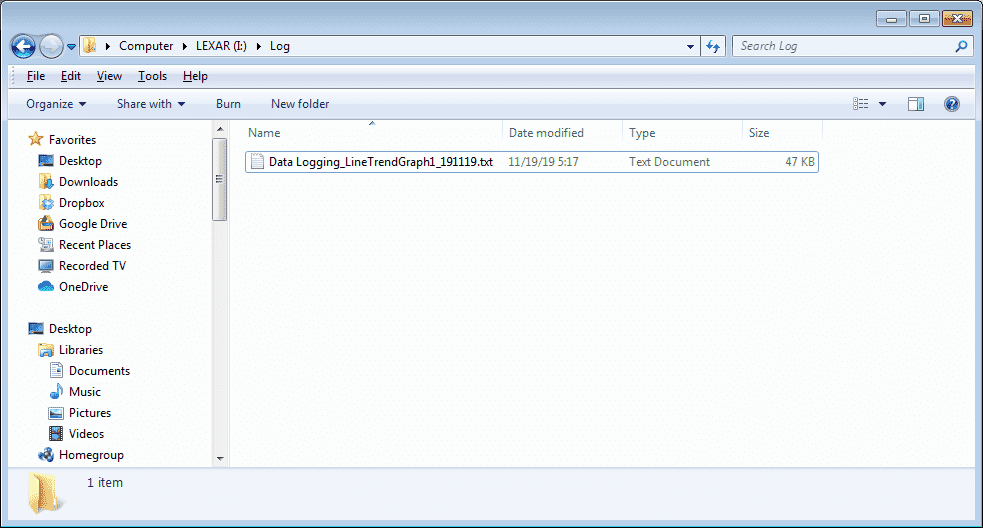
Select the Eject USB button on the CMore panel will allow you to remove the USB drive. Plug it into a computer and we can then read the file in windows explorer.
Download the PLC and C-More programs here.
Watch the video below to see data logging in action on our C-More EA9 HMI Panel.
C-More EA9 Panels from Automation Direct
https://www.automationdirect.com/adc/overview/catalog/hmi_(human_machine_interface)/c-more_touch_panels_ea9_series
C-More – Graphic Panel (EA9 Series) User Manual and Quick Start Guides
https://cdn.automationdirect.com/static/manuals/ea9userm/ea9userm.html
EA9-T10CL C-More Specifications
https://cdn.automationdirect.com/static/specs/ea9t10cl.pdf
C-More EA9 Programming Software (Current Version V6.42)
https://support.automationdirect.com/products/cmore.html
This software will enable you to program all of the C-More EA9 HMI units. It includes a simulator for your application.
Next time we will look at the FTP (File Transfer Protocol) capability of our C-More HMI Panel.
Watch on YouTube: C-More EA9 HMI Series Panel Data Logging
If you have any questions or need further information please contact me.
Thank you,
Garry
If you’re like most of my readers, you’re committed to learning about technology. Numbering systems used in PLC’s are not difficult to learn and understand. We will walk through the numbering systems used in PLCs. This includes Bits, Decimal, Hexadecimal, ASCII and Floating Point.
To get this free article, subscribe to my free email newsletter.
Use the information to inform other people how numbering systems work. Sign up now.
The ‘Robust Data Logging for Free’ eBook is also available as a free download. The link is included when you subscribe to ACC Automation.

